Tree View
Open Tree View
- Open a trace (from Traces).
- In the trace view toolbar, open the view mode dropdown.
- Select Tree (you can switch back the same way).
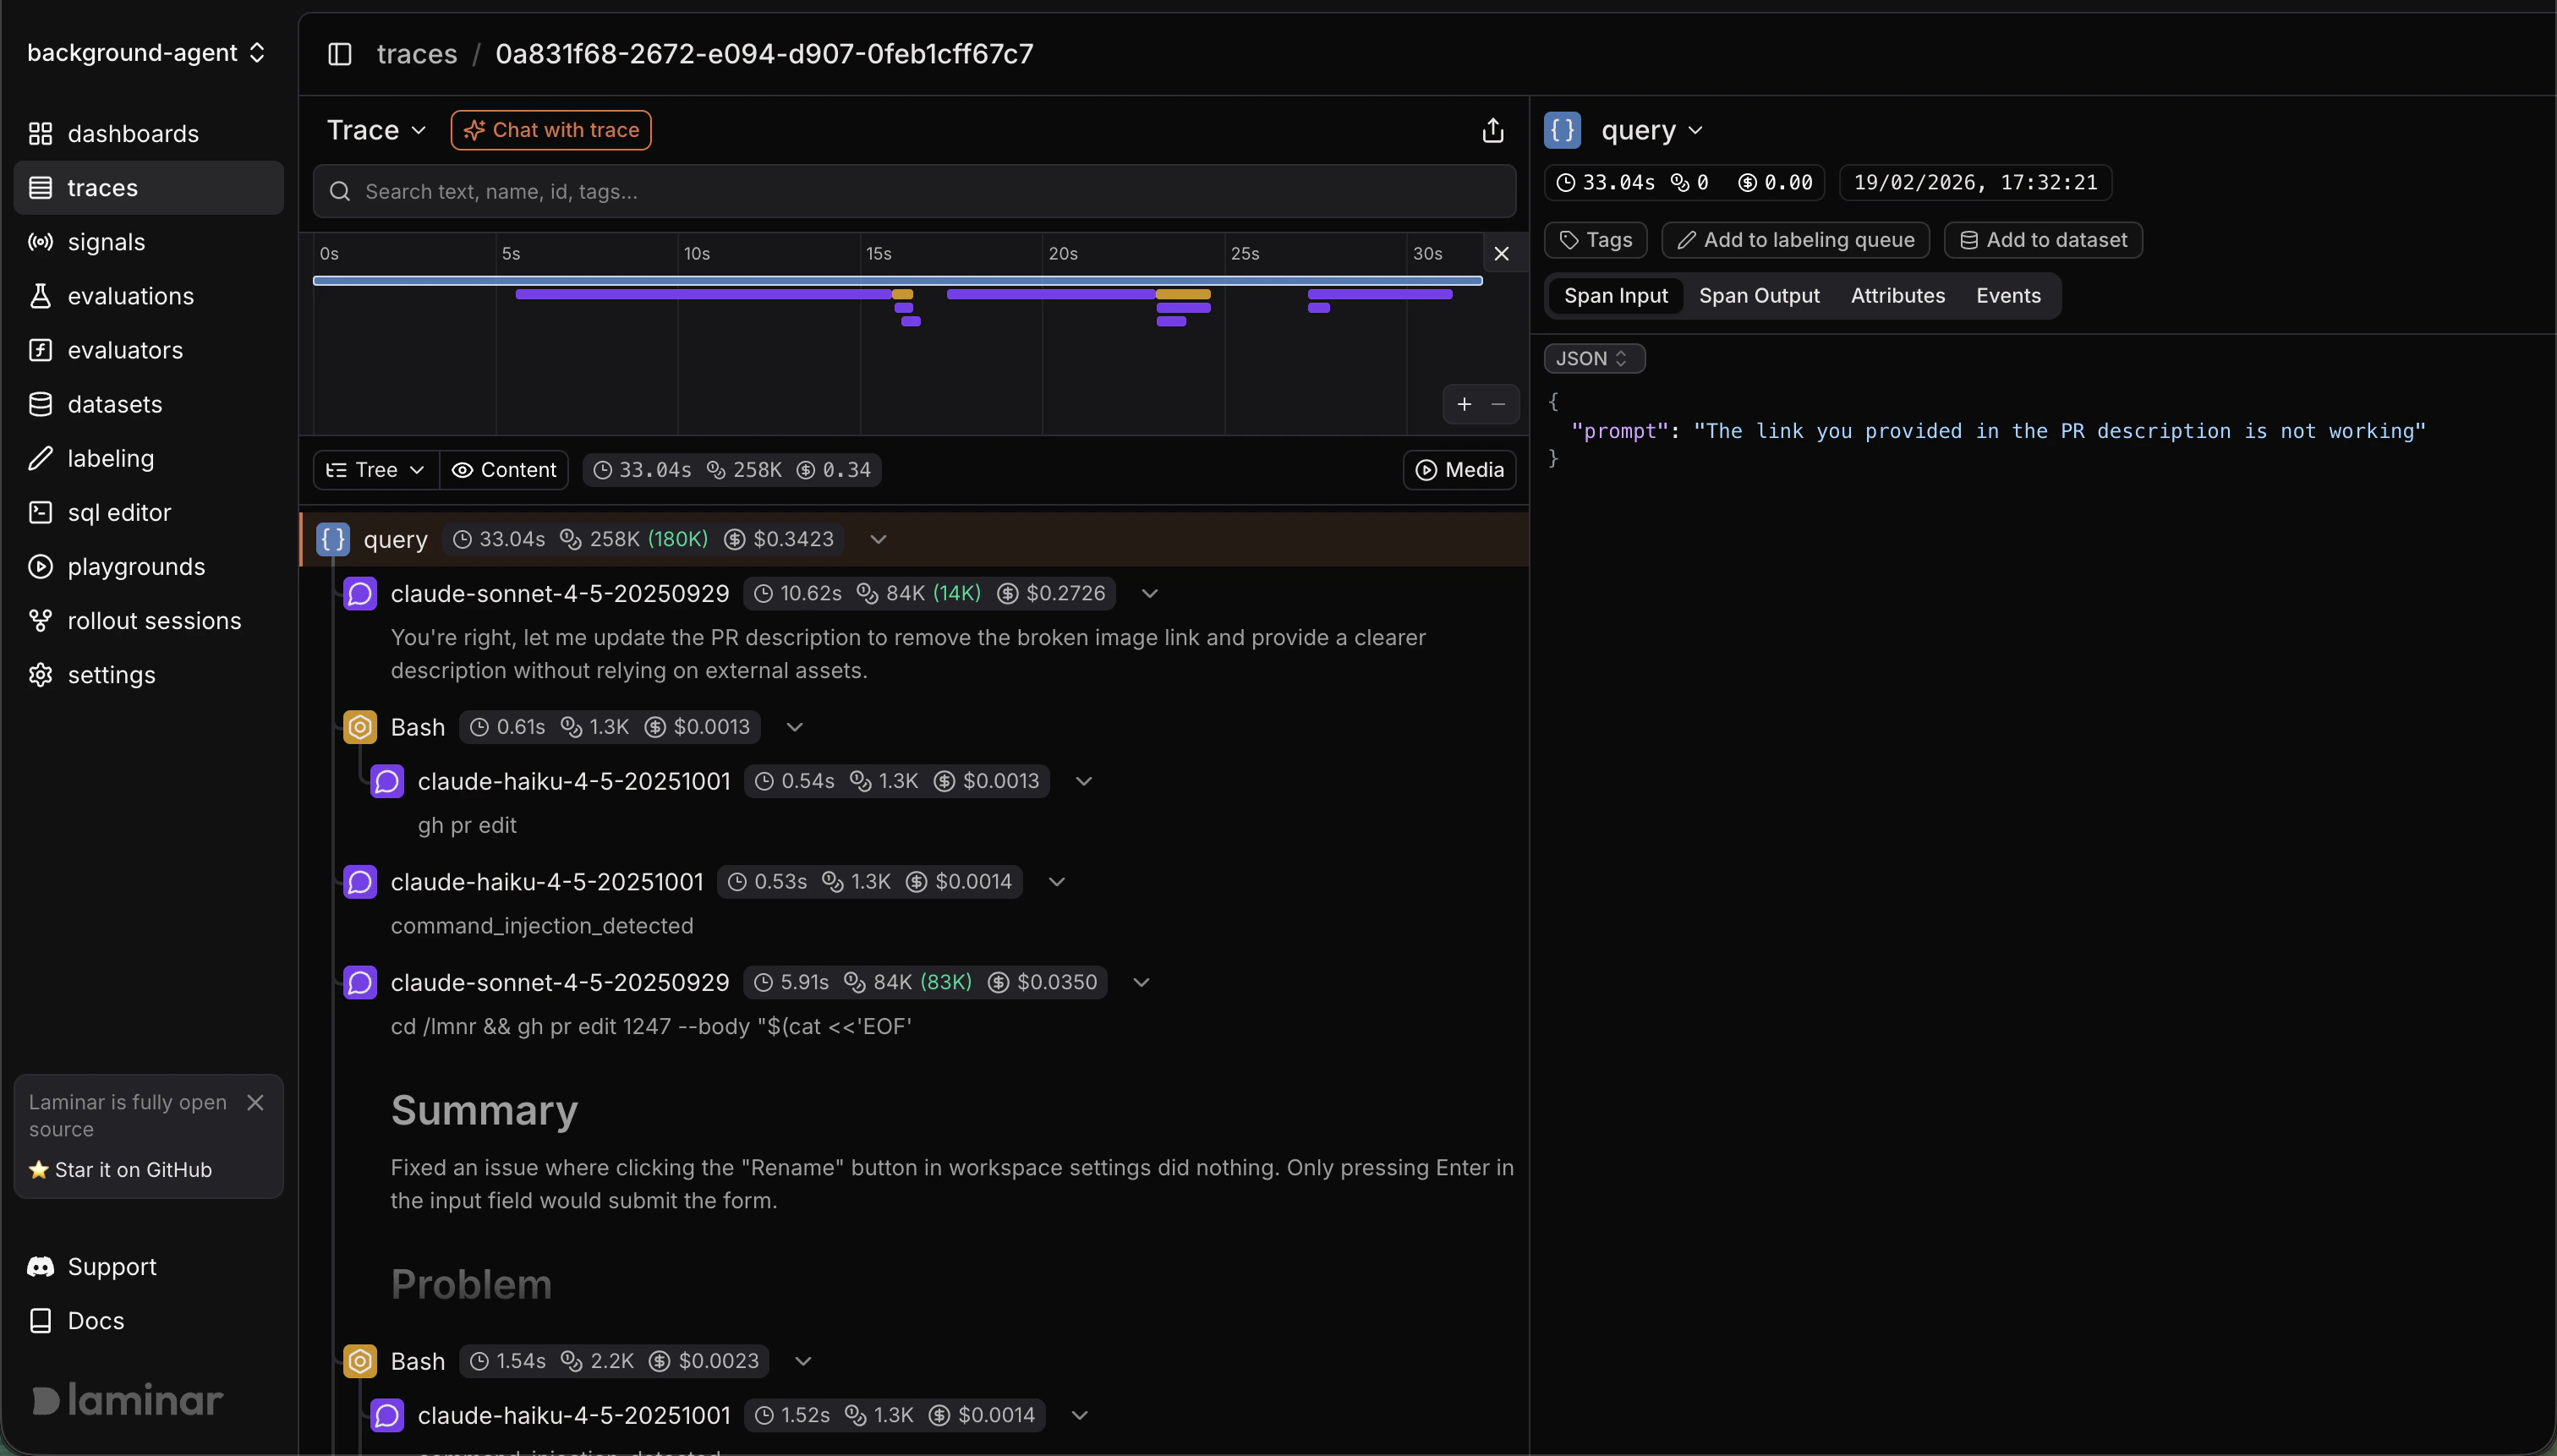
- Hierarchy-first view: Shows parent/child nesting so you can follow the trace’s call structure.
- Collapsible branches: Collapse spans with children to hide entire subtrees and reduce noise.
- Inline metrics: Duration on every row; tokens/cost badges on LLM spans.
- Fast navigation: Virtualized list stays responsive even on large traces.
- Synced minimap: Jump to spans quickly and scrub the shared session-time cursor.
Reader Mode
Reader Mode gives you a readable, flattened view of a trace designed for fast scanning and review.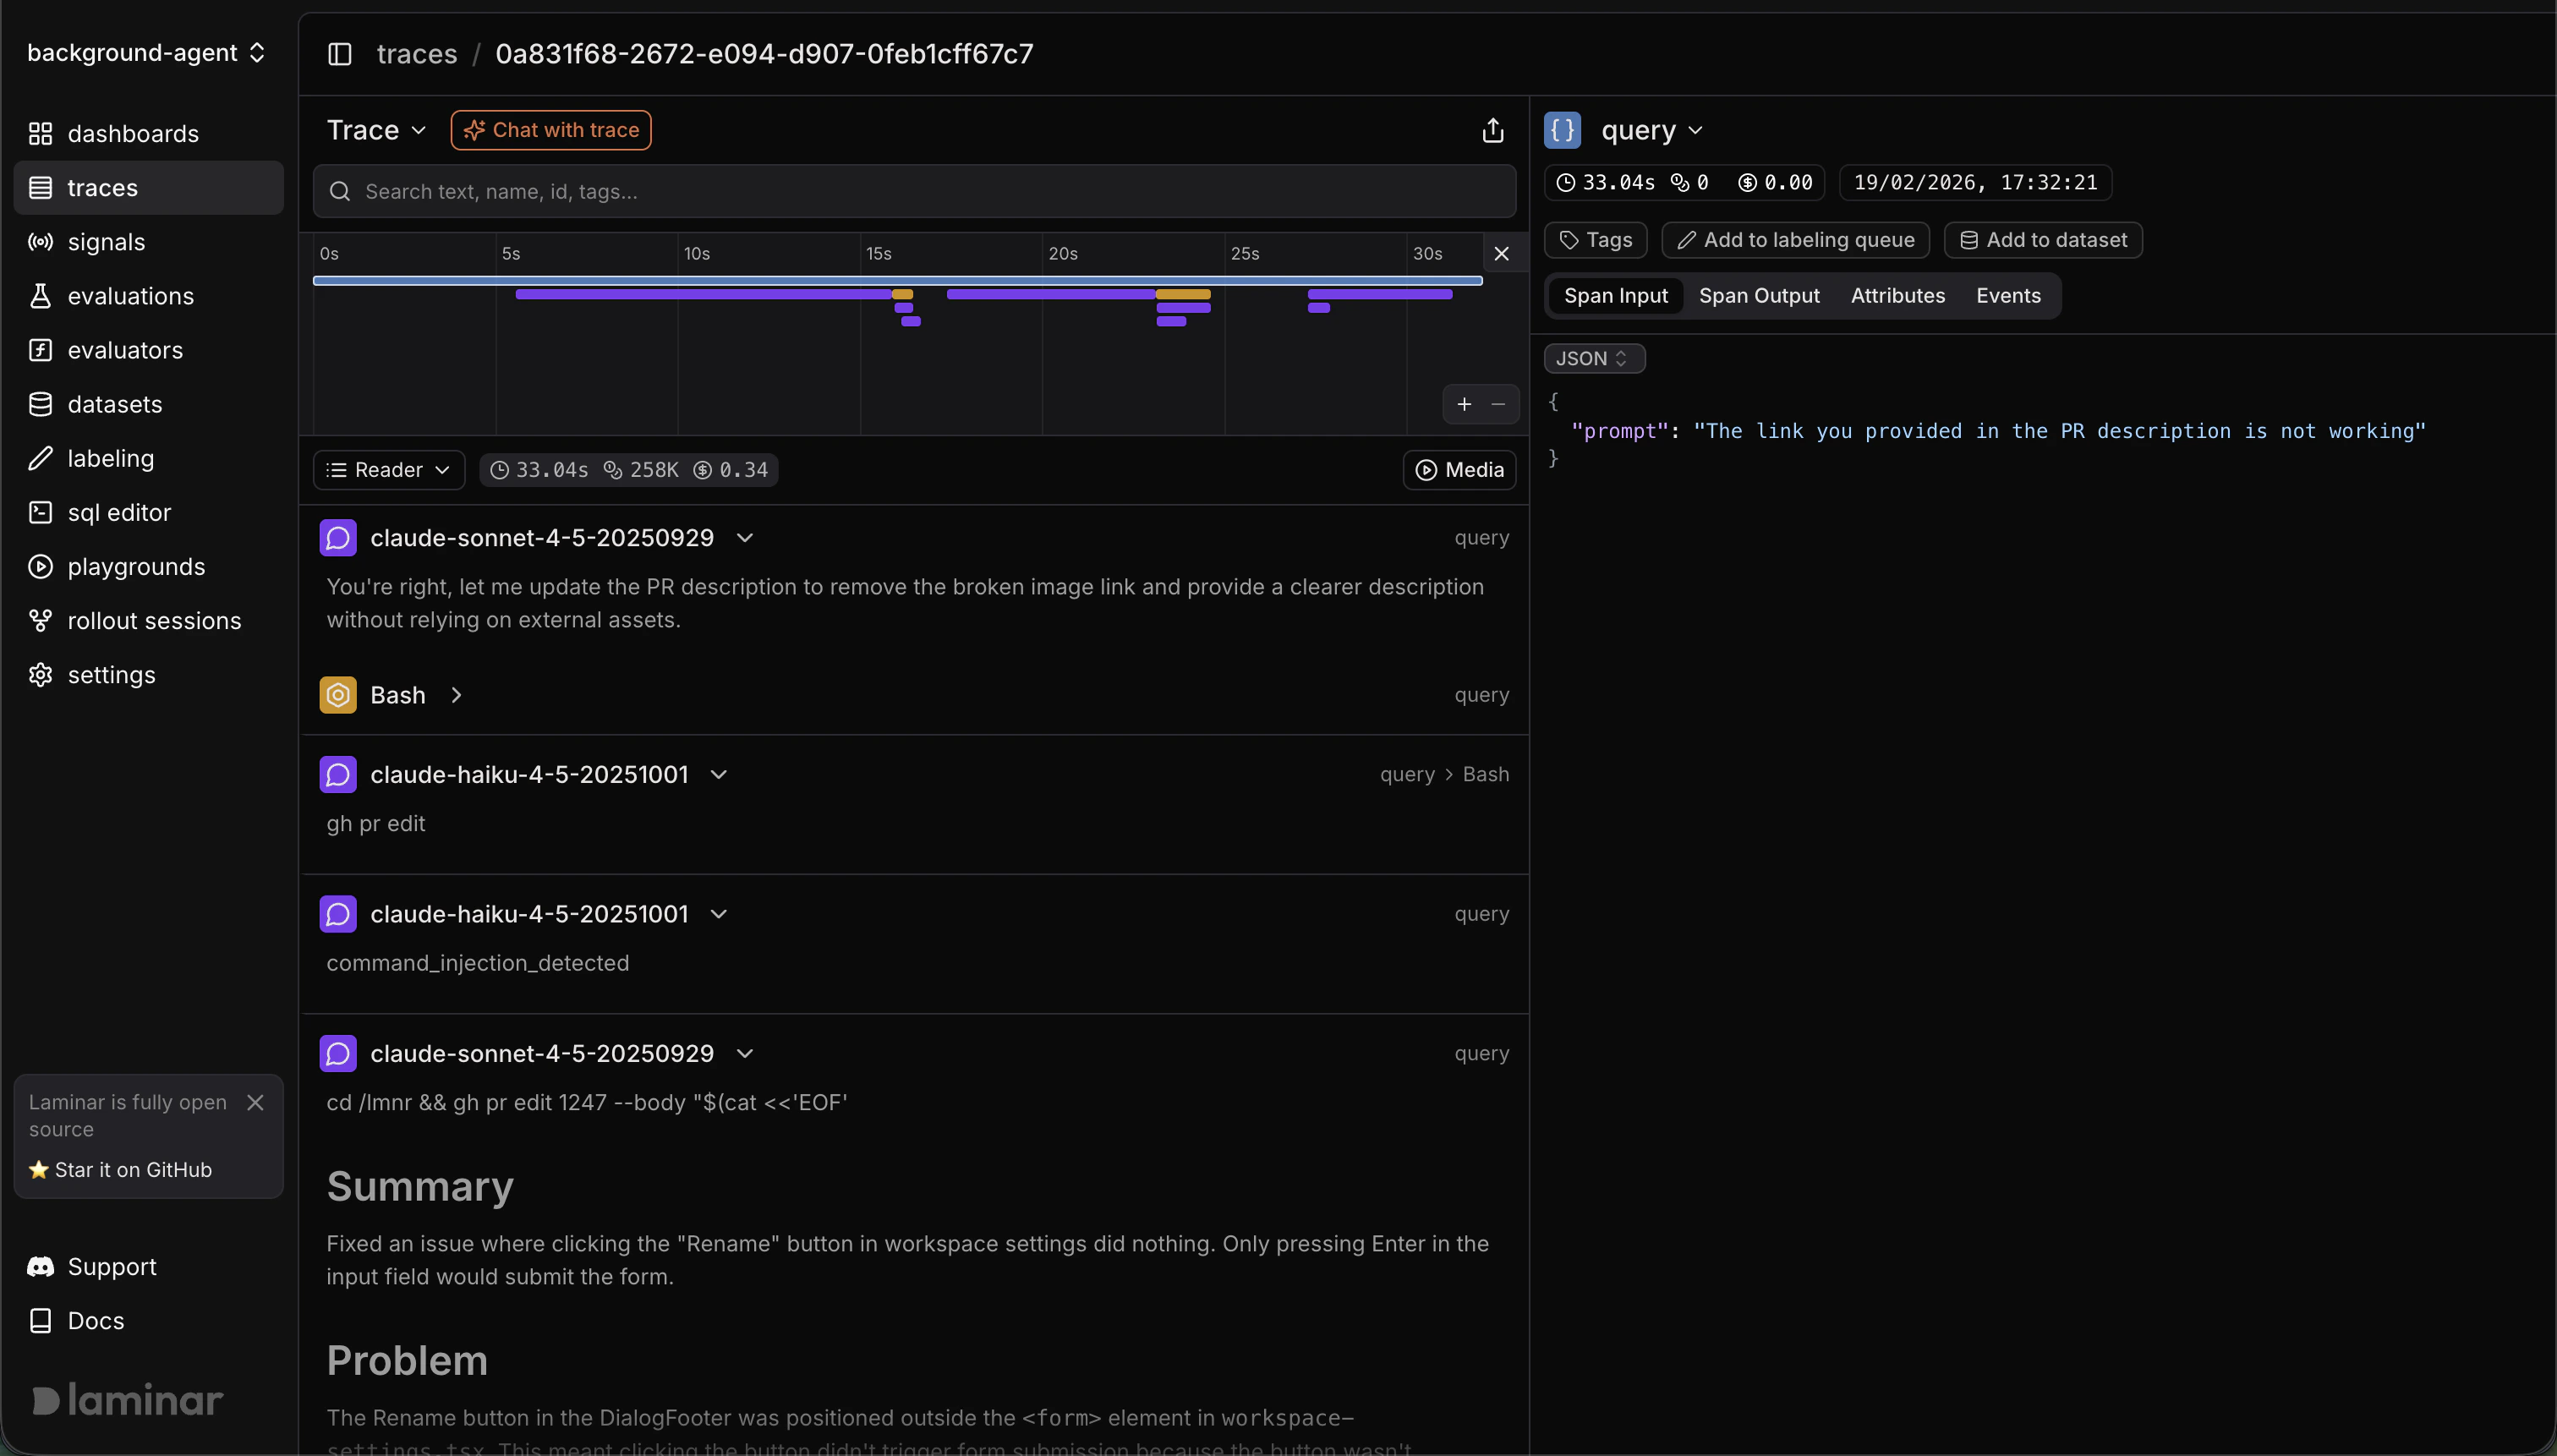
Open Reader Mode
- Open a trace (from Traces).
- In the trace view header, open the view mode dropdown.
- Select Reader Mode (you can switch back the same way).
- High-signal view: Shows only LLM and tool-call spans by default (other spans hidden), making the trace much easier to parse.
- At-a-glance columns: Type/model, timing, tokens/cost, and breadcrumbs per row.
- Expandable rows: Open any row to see formatted outputs; selecting still opens the full span detail pane on the right.
- Lazy-loaded outputs: Fetches only what’s on screen to keep the UI fast.
- Templates per path: Apply saved Mustache templates per span path to reshape how outputs render.
- Synced minimap: Highlights spans in view and lets you jump or scrub session time.
Timeline
Open Timeline
- Open a trace (from Traces).
- In the trace header, click the Timeline toggle (Gantt icon) below the search bar.
- The condensed timeline appears at the top of the trace view. Click the toggle again to hide it.
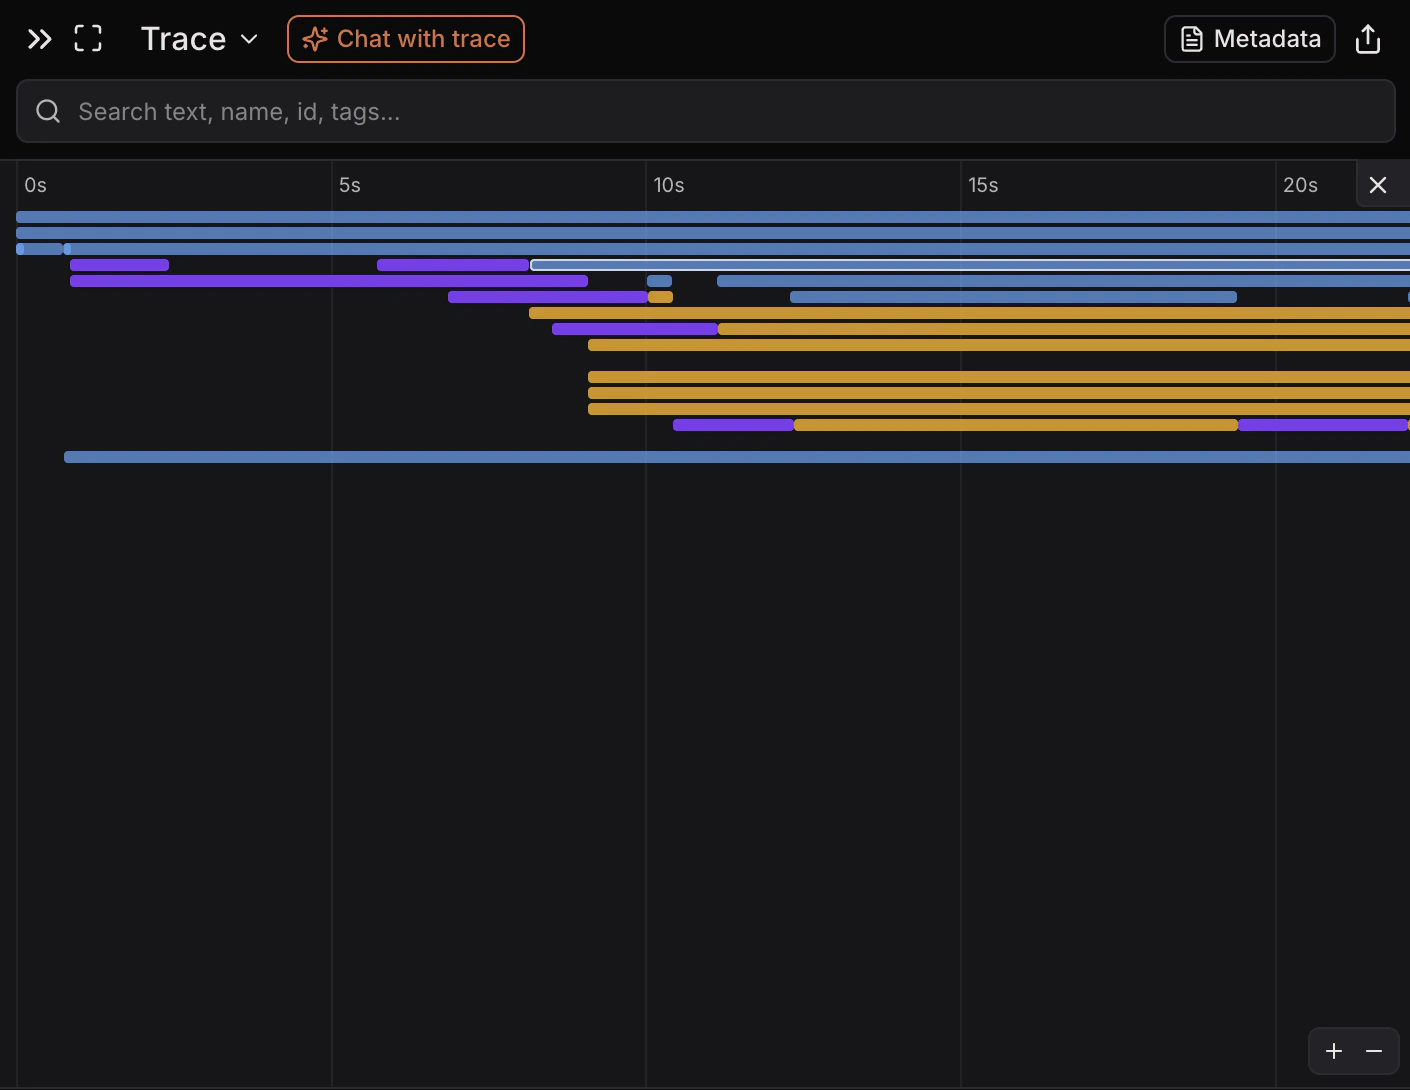
- Time-first overview: Spans render as colored bars on a single time axis.
- Zoom controls: Use the +/- buttons (or cmd/ctrl + scroll) to zoom in/ out.
- Hover needle: Move your cursor to see precise time markers.
- Span selection: Drag to select a range; non-selected spans dim and you can clear the selection.
- Session playhead (if available): Shows the browser session position on the timeline.
Metadata
Open Metadata
- Open a trace (from Traces).
- In the trace view toolbar, click Metadata.
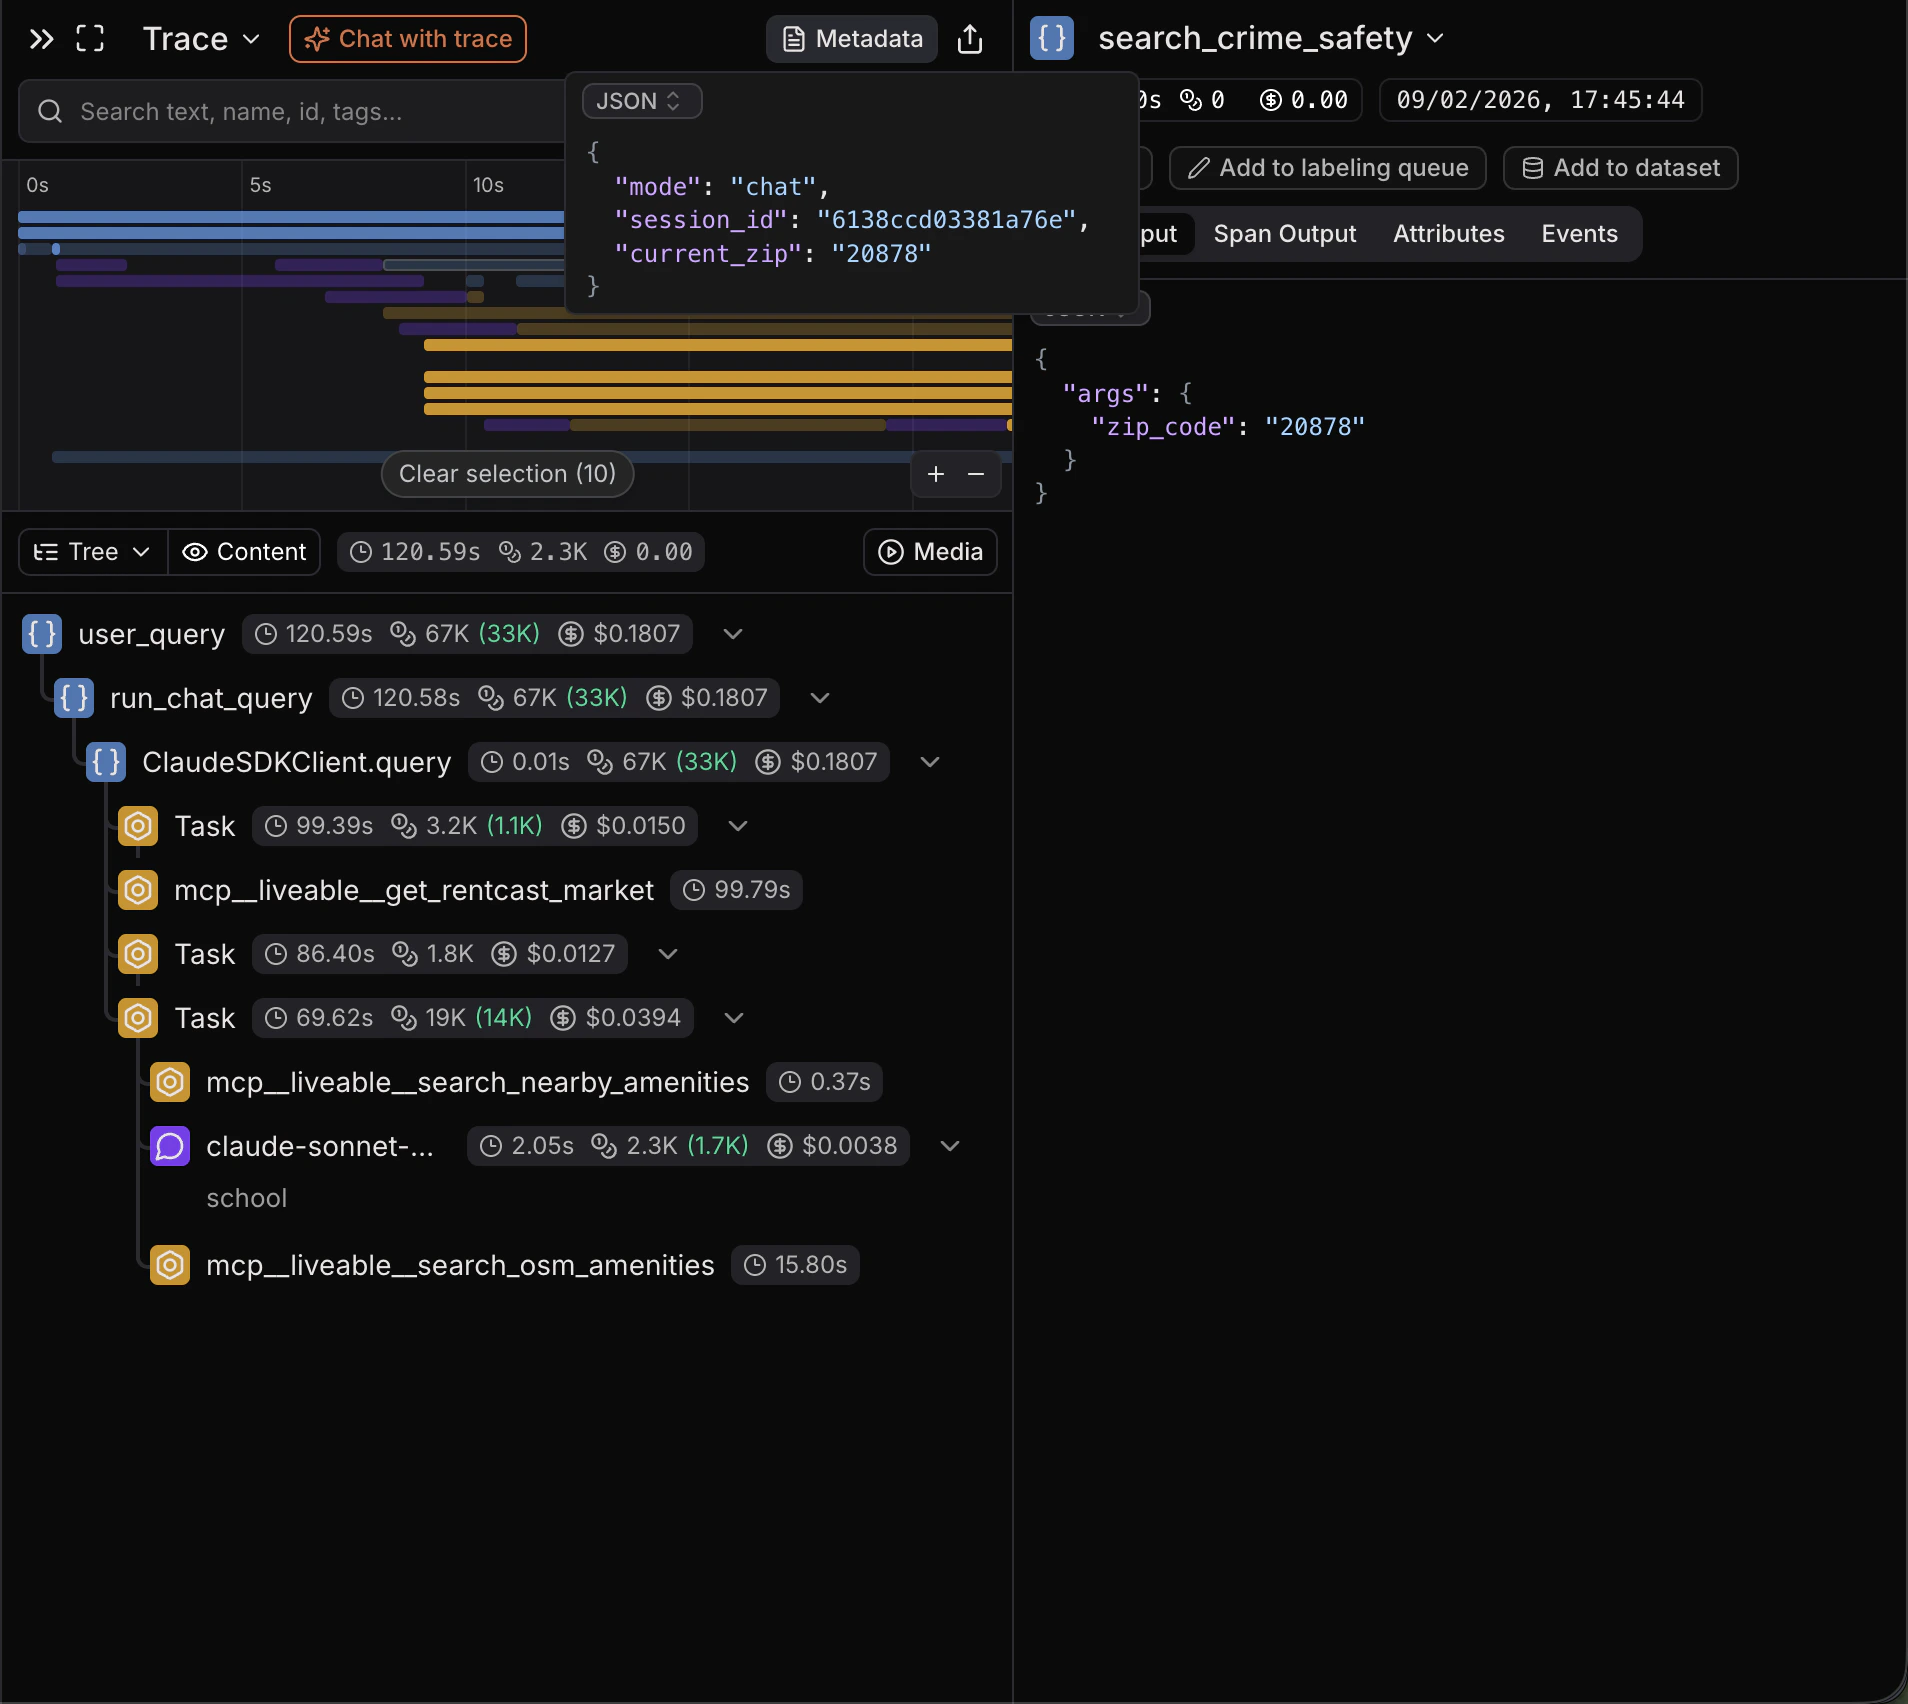
- Read-only source of truth: Shows the trace metadata exactly as stored.
- JSON-first: Defaults to a JSON view with formatting and syntax highlighting.
- Search/copy friendly: Quickly find keys/values and copy raw text as needed.
Chat with trace
Open Chat with trace
- Open a trace (from Traces).
- In the trace view toolbar, click Chat with trace.
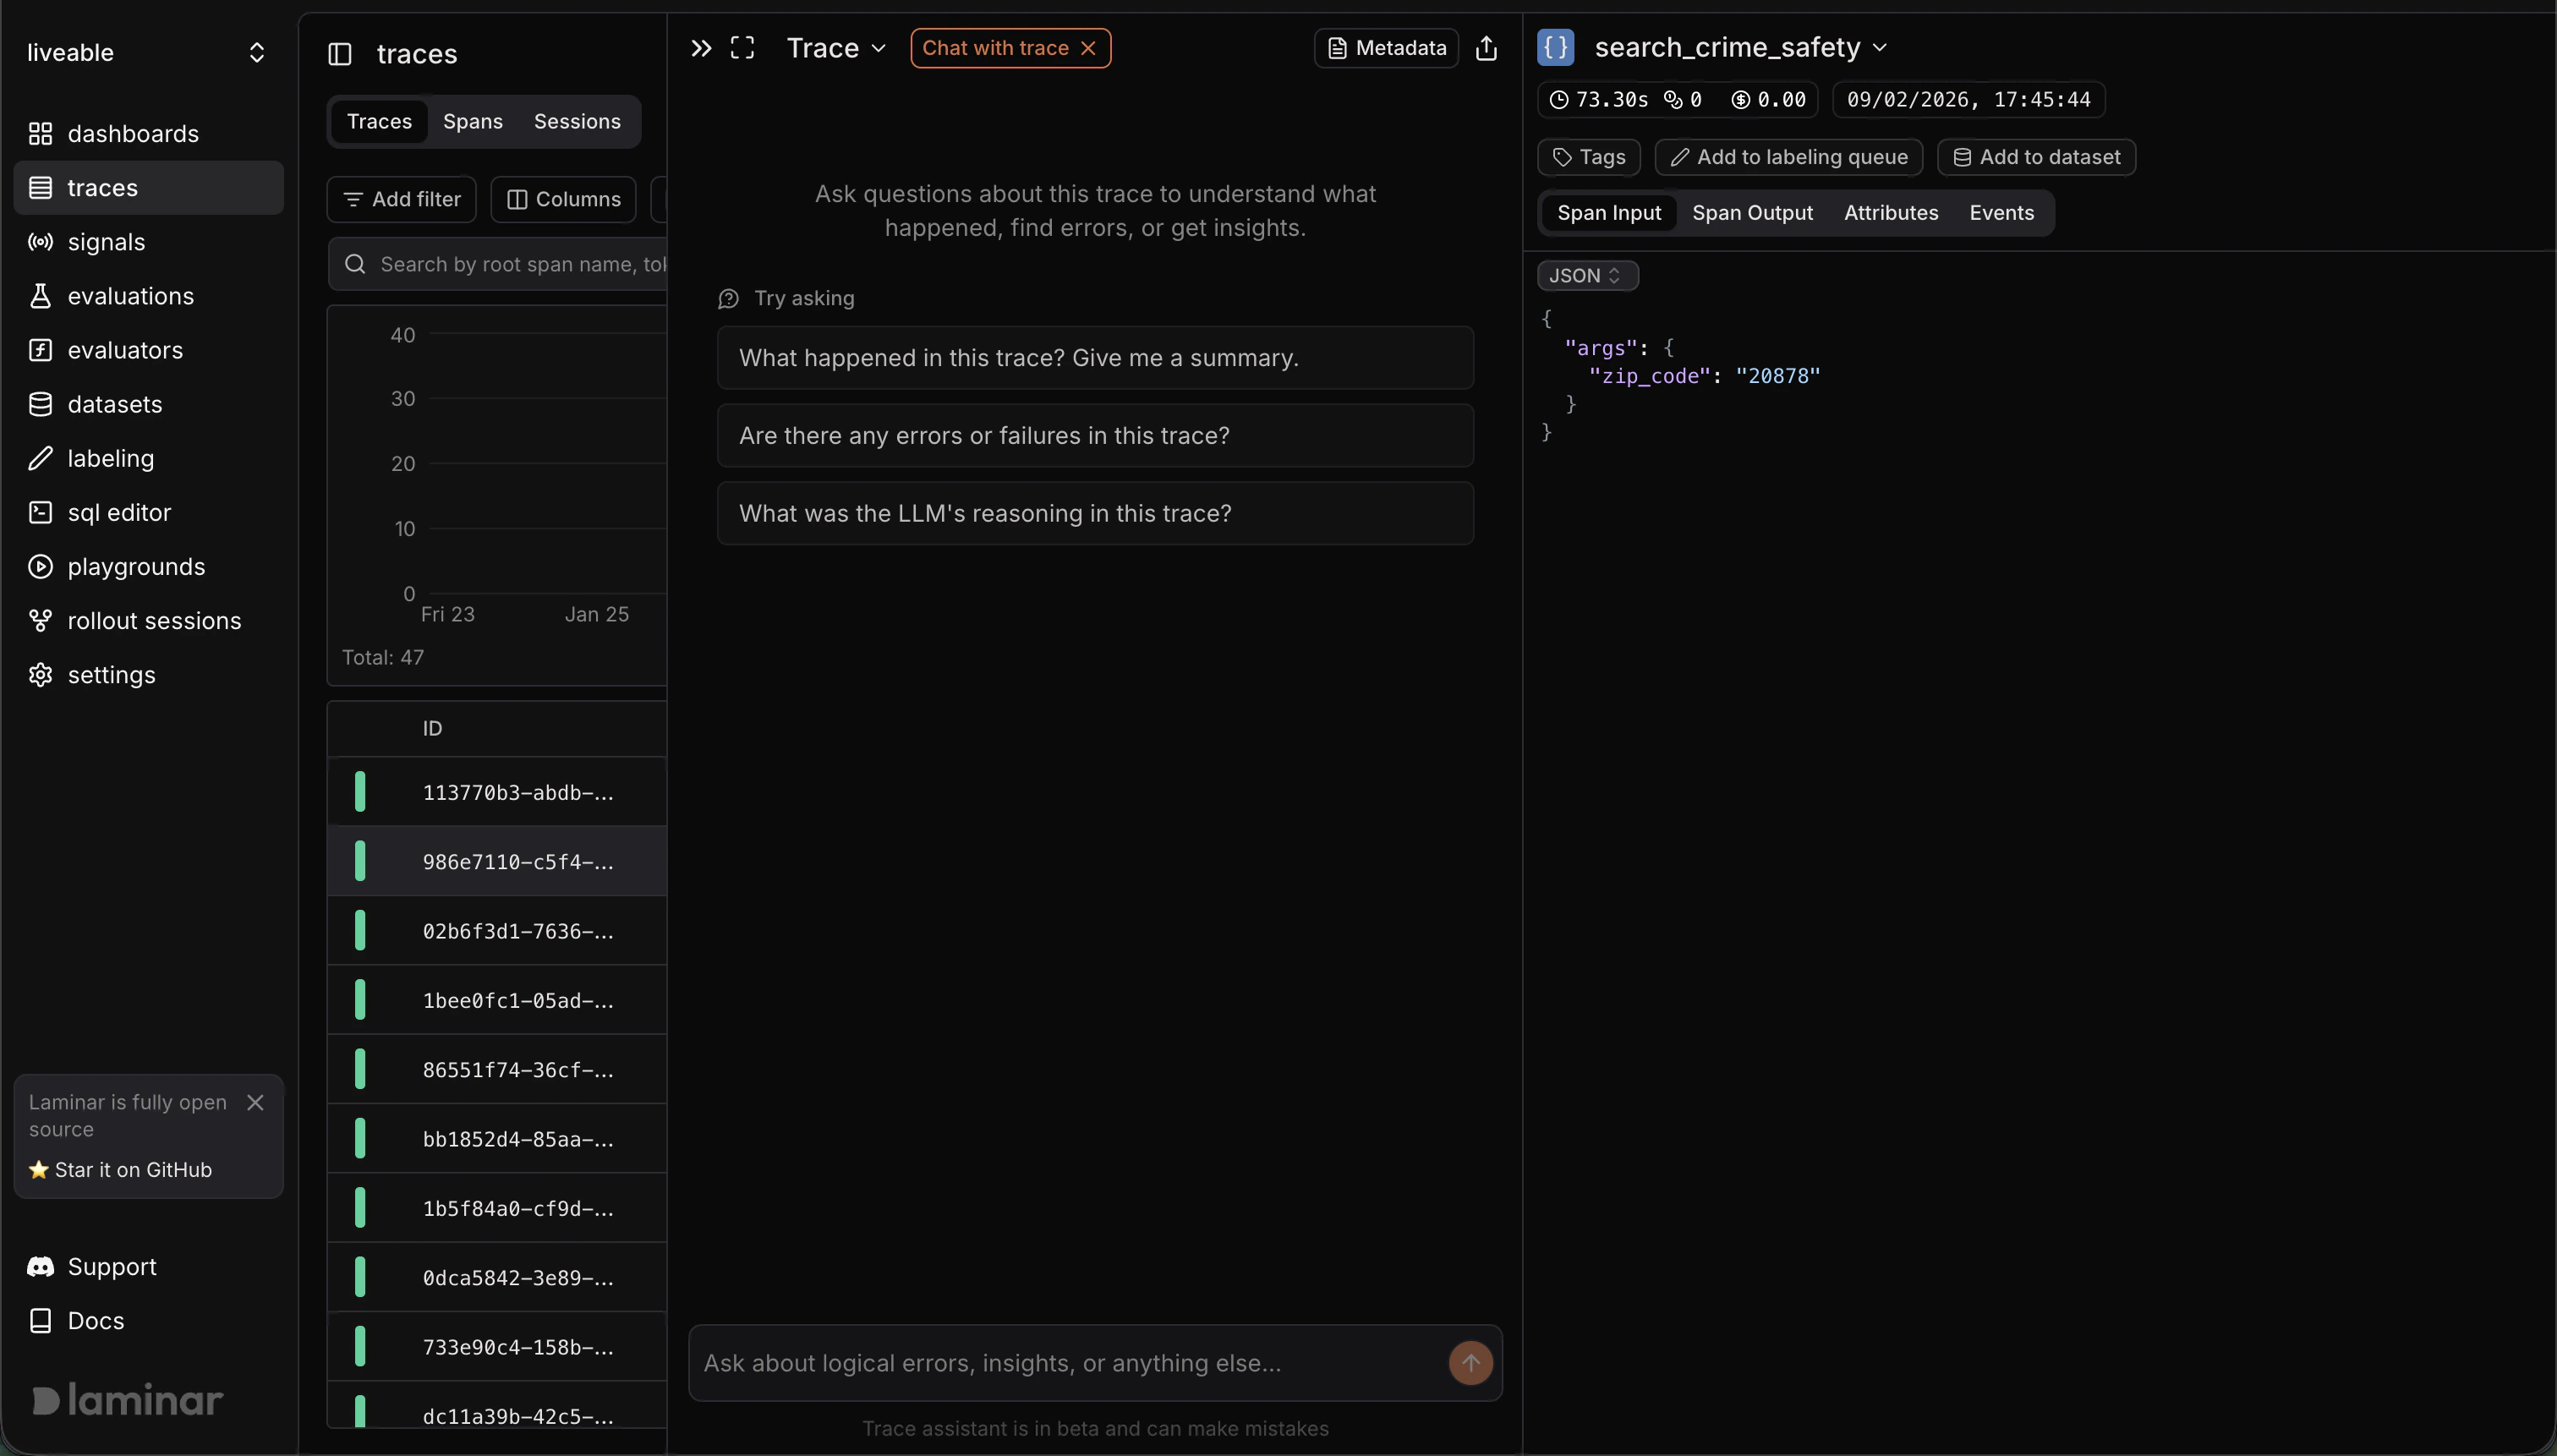
- Automatic summary: Generates a trace summary (and deeper analysis) to orient you quickly.
- Span-aware answers: When the assistant cites spans, they show up as clickable chips that jump you to the referenced span.
- Iterate fast: Ask follow-ups about errors, unexpected outputs, tool calls, or performance.
- Resettable: Start a new chat when you want a fresh thread.
Open in SQL Editor
- Open a trace (from Traces).
- In the trace view header, open the Trace dropdown.
- Select Open in SQL editor (opens in a new tab).
- Pre-filled query (trace): Starts with
SELECT * FROM spans WHERE trace_id = ... ORDER BY start_time ASC. - Pre-filled query (span): From a span’s detail header dropdown, Open in SQL editor creates
SELECT * FROM spans WHERE span_id = ....