trace_id to the semantic-event service. The service returns a structured payload that Laminar stores as a signal event linked to that trace.
Signals also support two execution modes:
- backfill jobs on historical traces
- live triggers for new traces
When to use LLM signals
- Business outcomes - Describe criteria for a successful outcome, for example “User responded with ‘Thank you’”.
- Logical errors - Describe a case when an agent fails to complete a task, for example “Agent fails to complete checkout process”.
- Behavioral patterns - Categorize user requests by specifying “request category” in the structured output schema.
Create a signal
To define a new signal from trace data: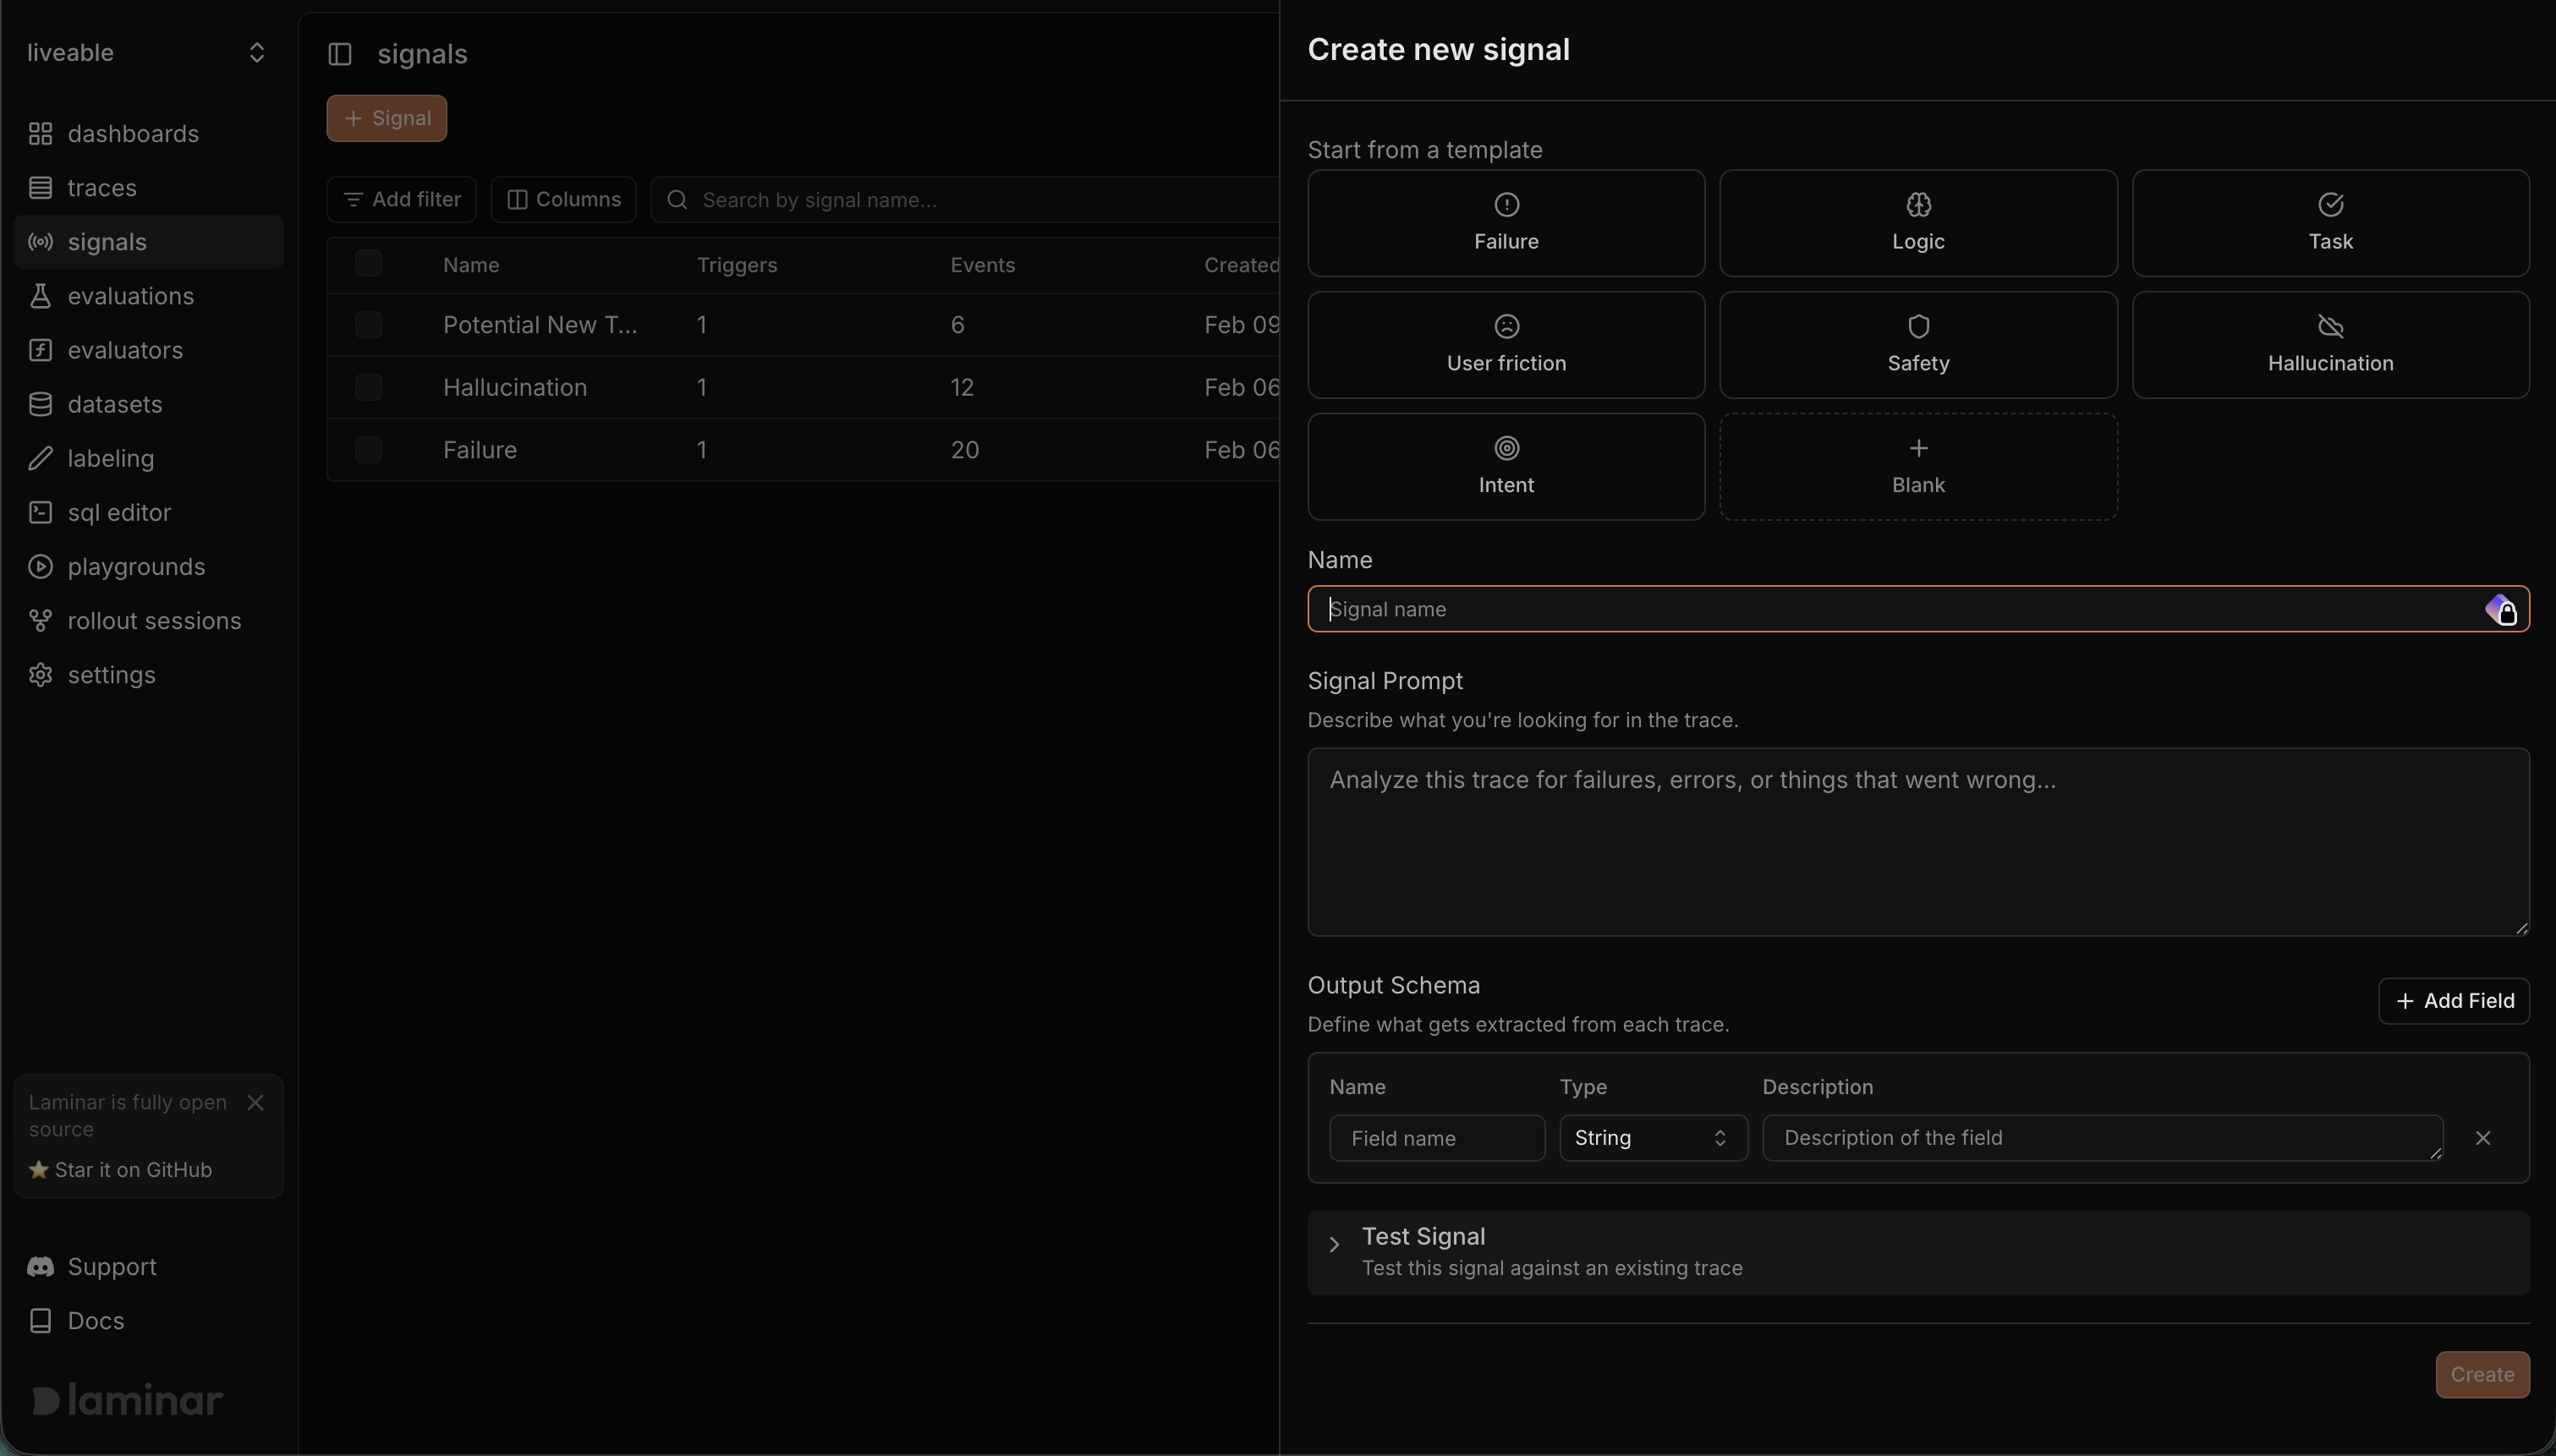
- Open Signals and click Create signal.
- (Optional) Start from a template to prefill the prompt and schema.
- Fill in:
- Name: choose a stable signal name (for example,
checkout.completedornavigation.failed). - Prompt: describe what the signal should detect or extract from trace data.
- Structured Output: define a JSON schema for the signal payload (keep it small and stable).
- (Optional) Test Signal: enter a trace ID to validate the output before creating it.
- Name: choose a stable signal name (for example,
- Click Create.
Run the signal on traces
Once the signal exists:- Use Jobs to backfill a time range or filtered set of traces.
- Use Triggers to keep the signal running on new traces that match your trigger filters.
Jobs (backfill)
Use a job when you want to run a signal against historical traces or a filtered slice of data.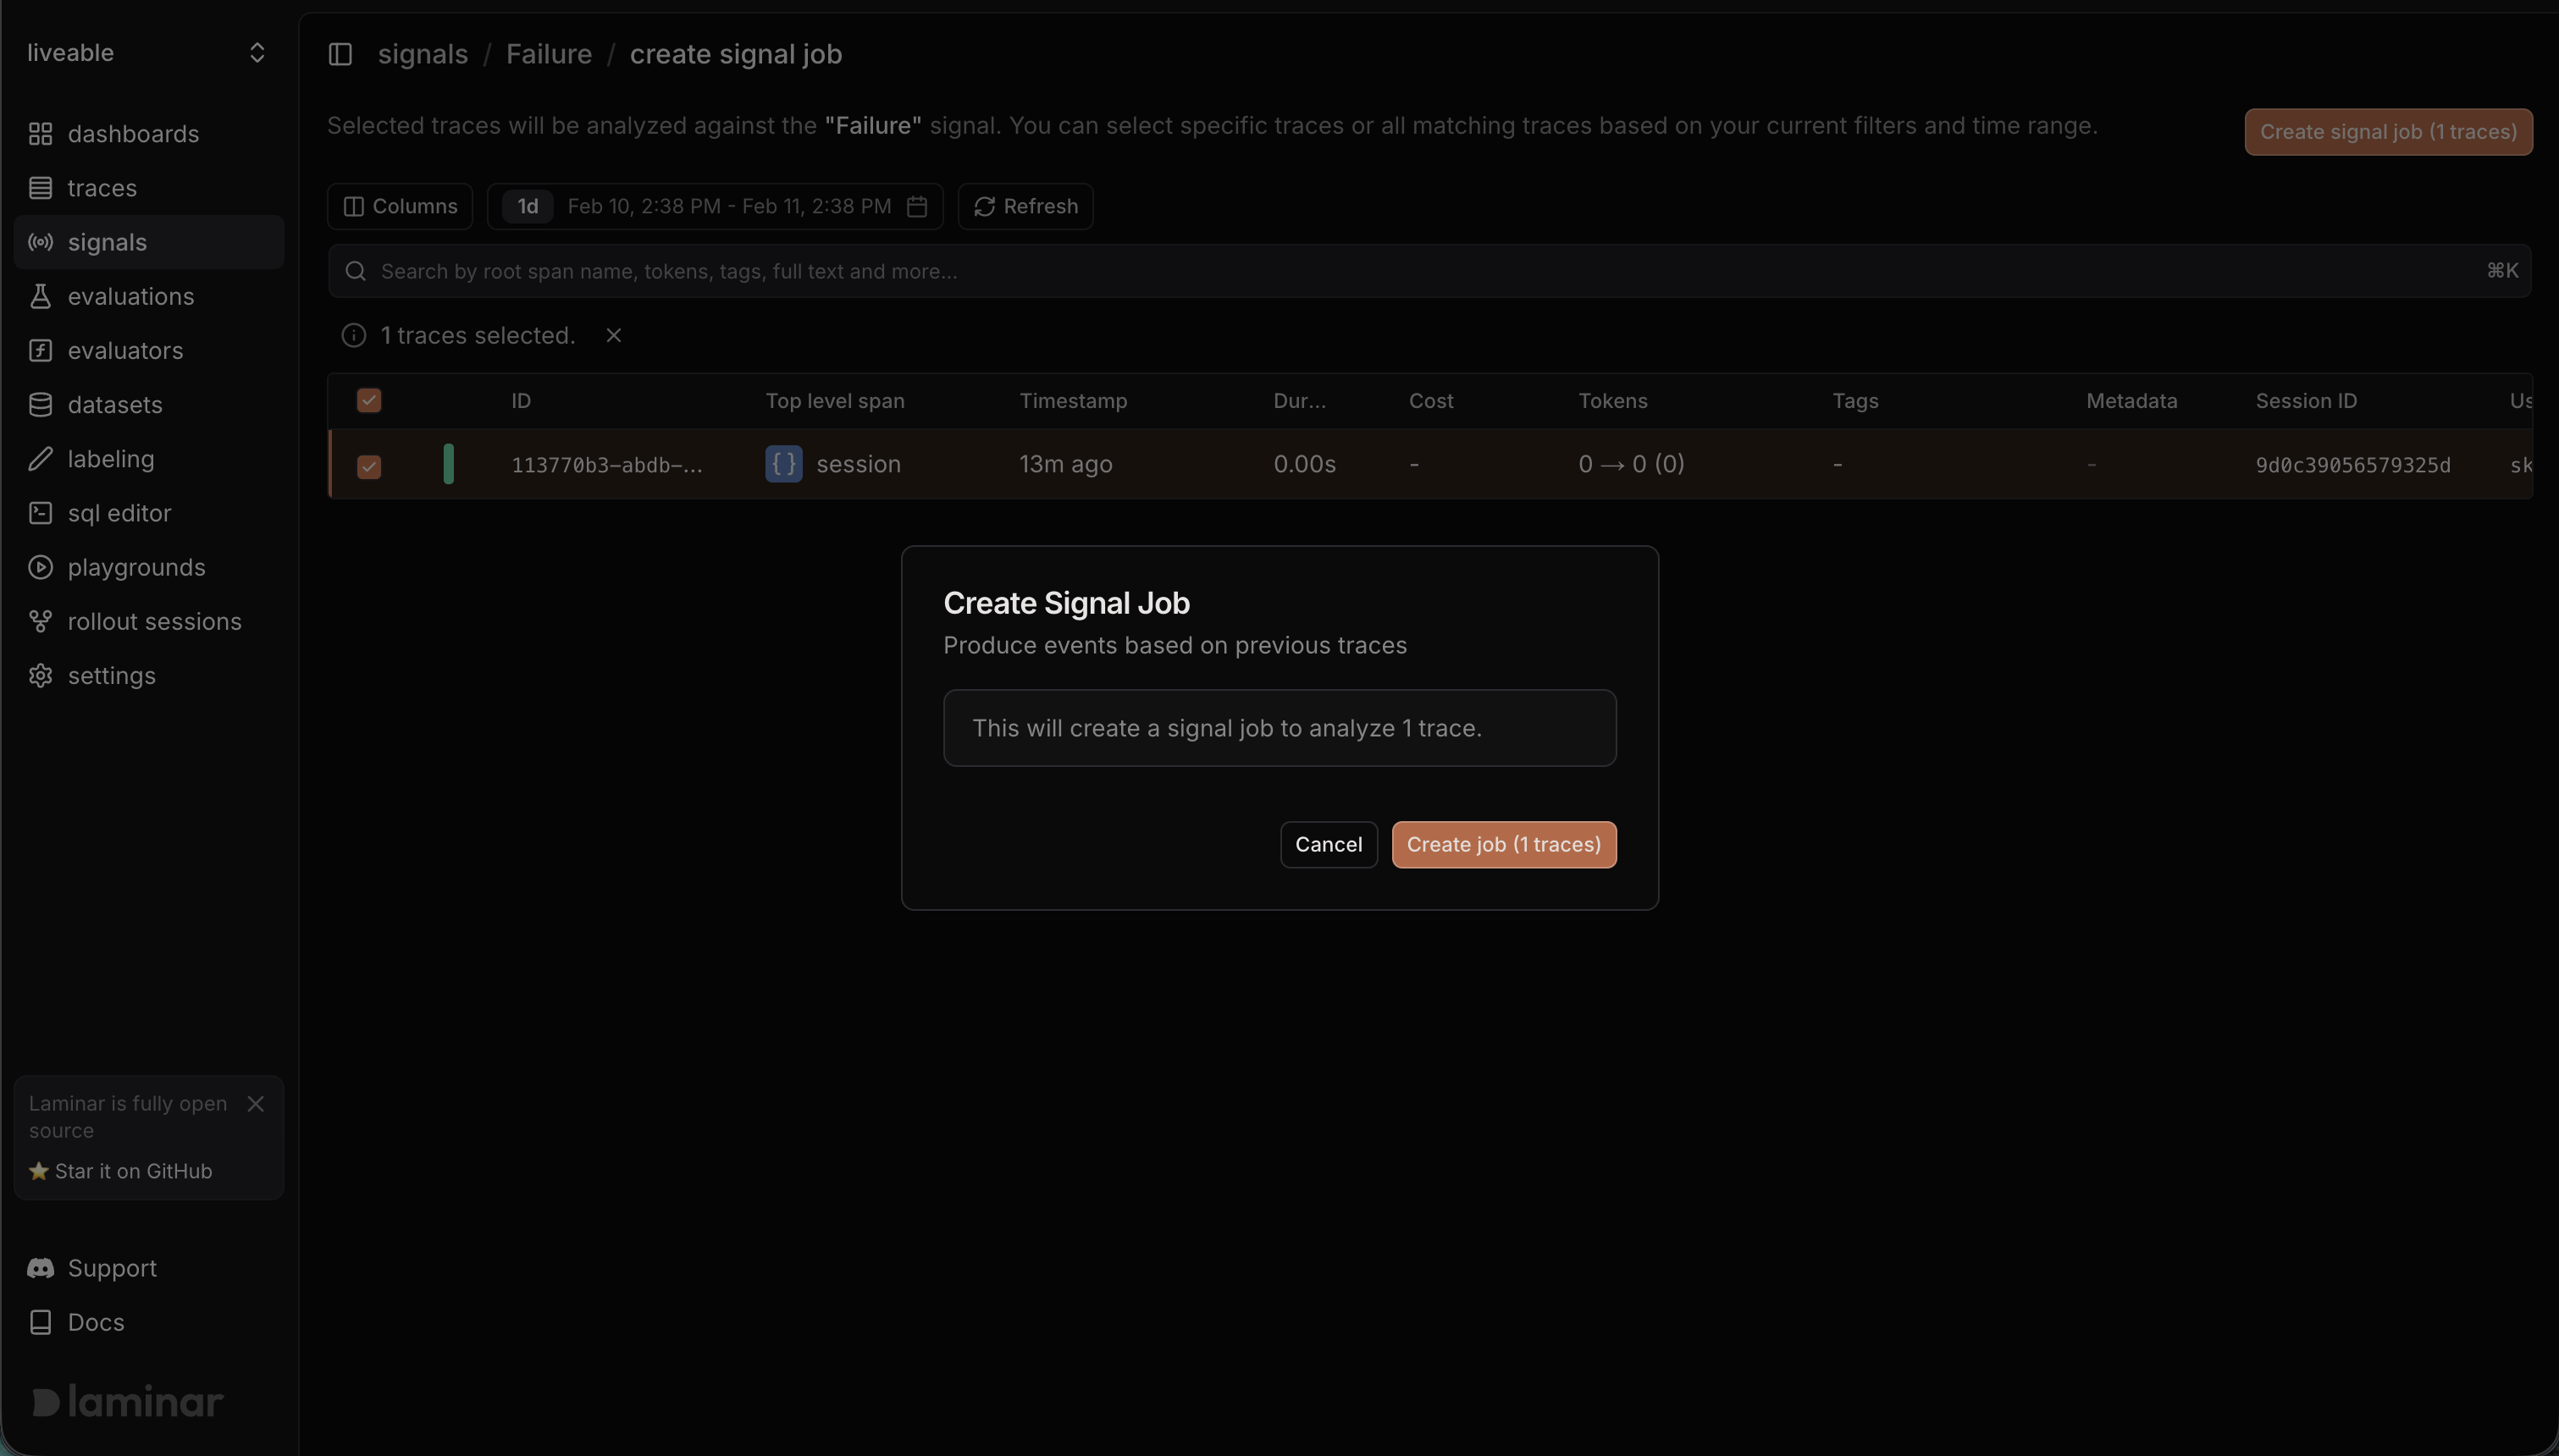
- Go to the signal’s Jobs tab and click Create Job.
- Pick a time range (default is the last 24 hours).
- Add filters and/or search to narrow the trace set.
- Select either specific traces or all traces matching your filters.
- Click Create signal job to enqueue processing.
- A job creates one run per trace.
- Runs appear in the Runs tab with status (Pending, Completed, Failed).
- If the signal is identified, you will see an Event ID and the signal appears in the Events tab.
- If the signal is not identified, the run completes without an event.
Triggers (live)
Use a trigger to run the signal automatically on new traces.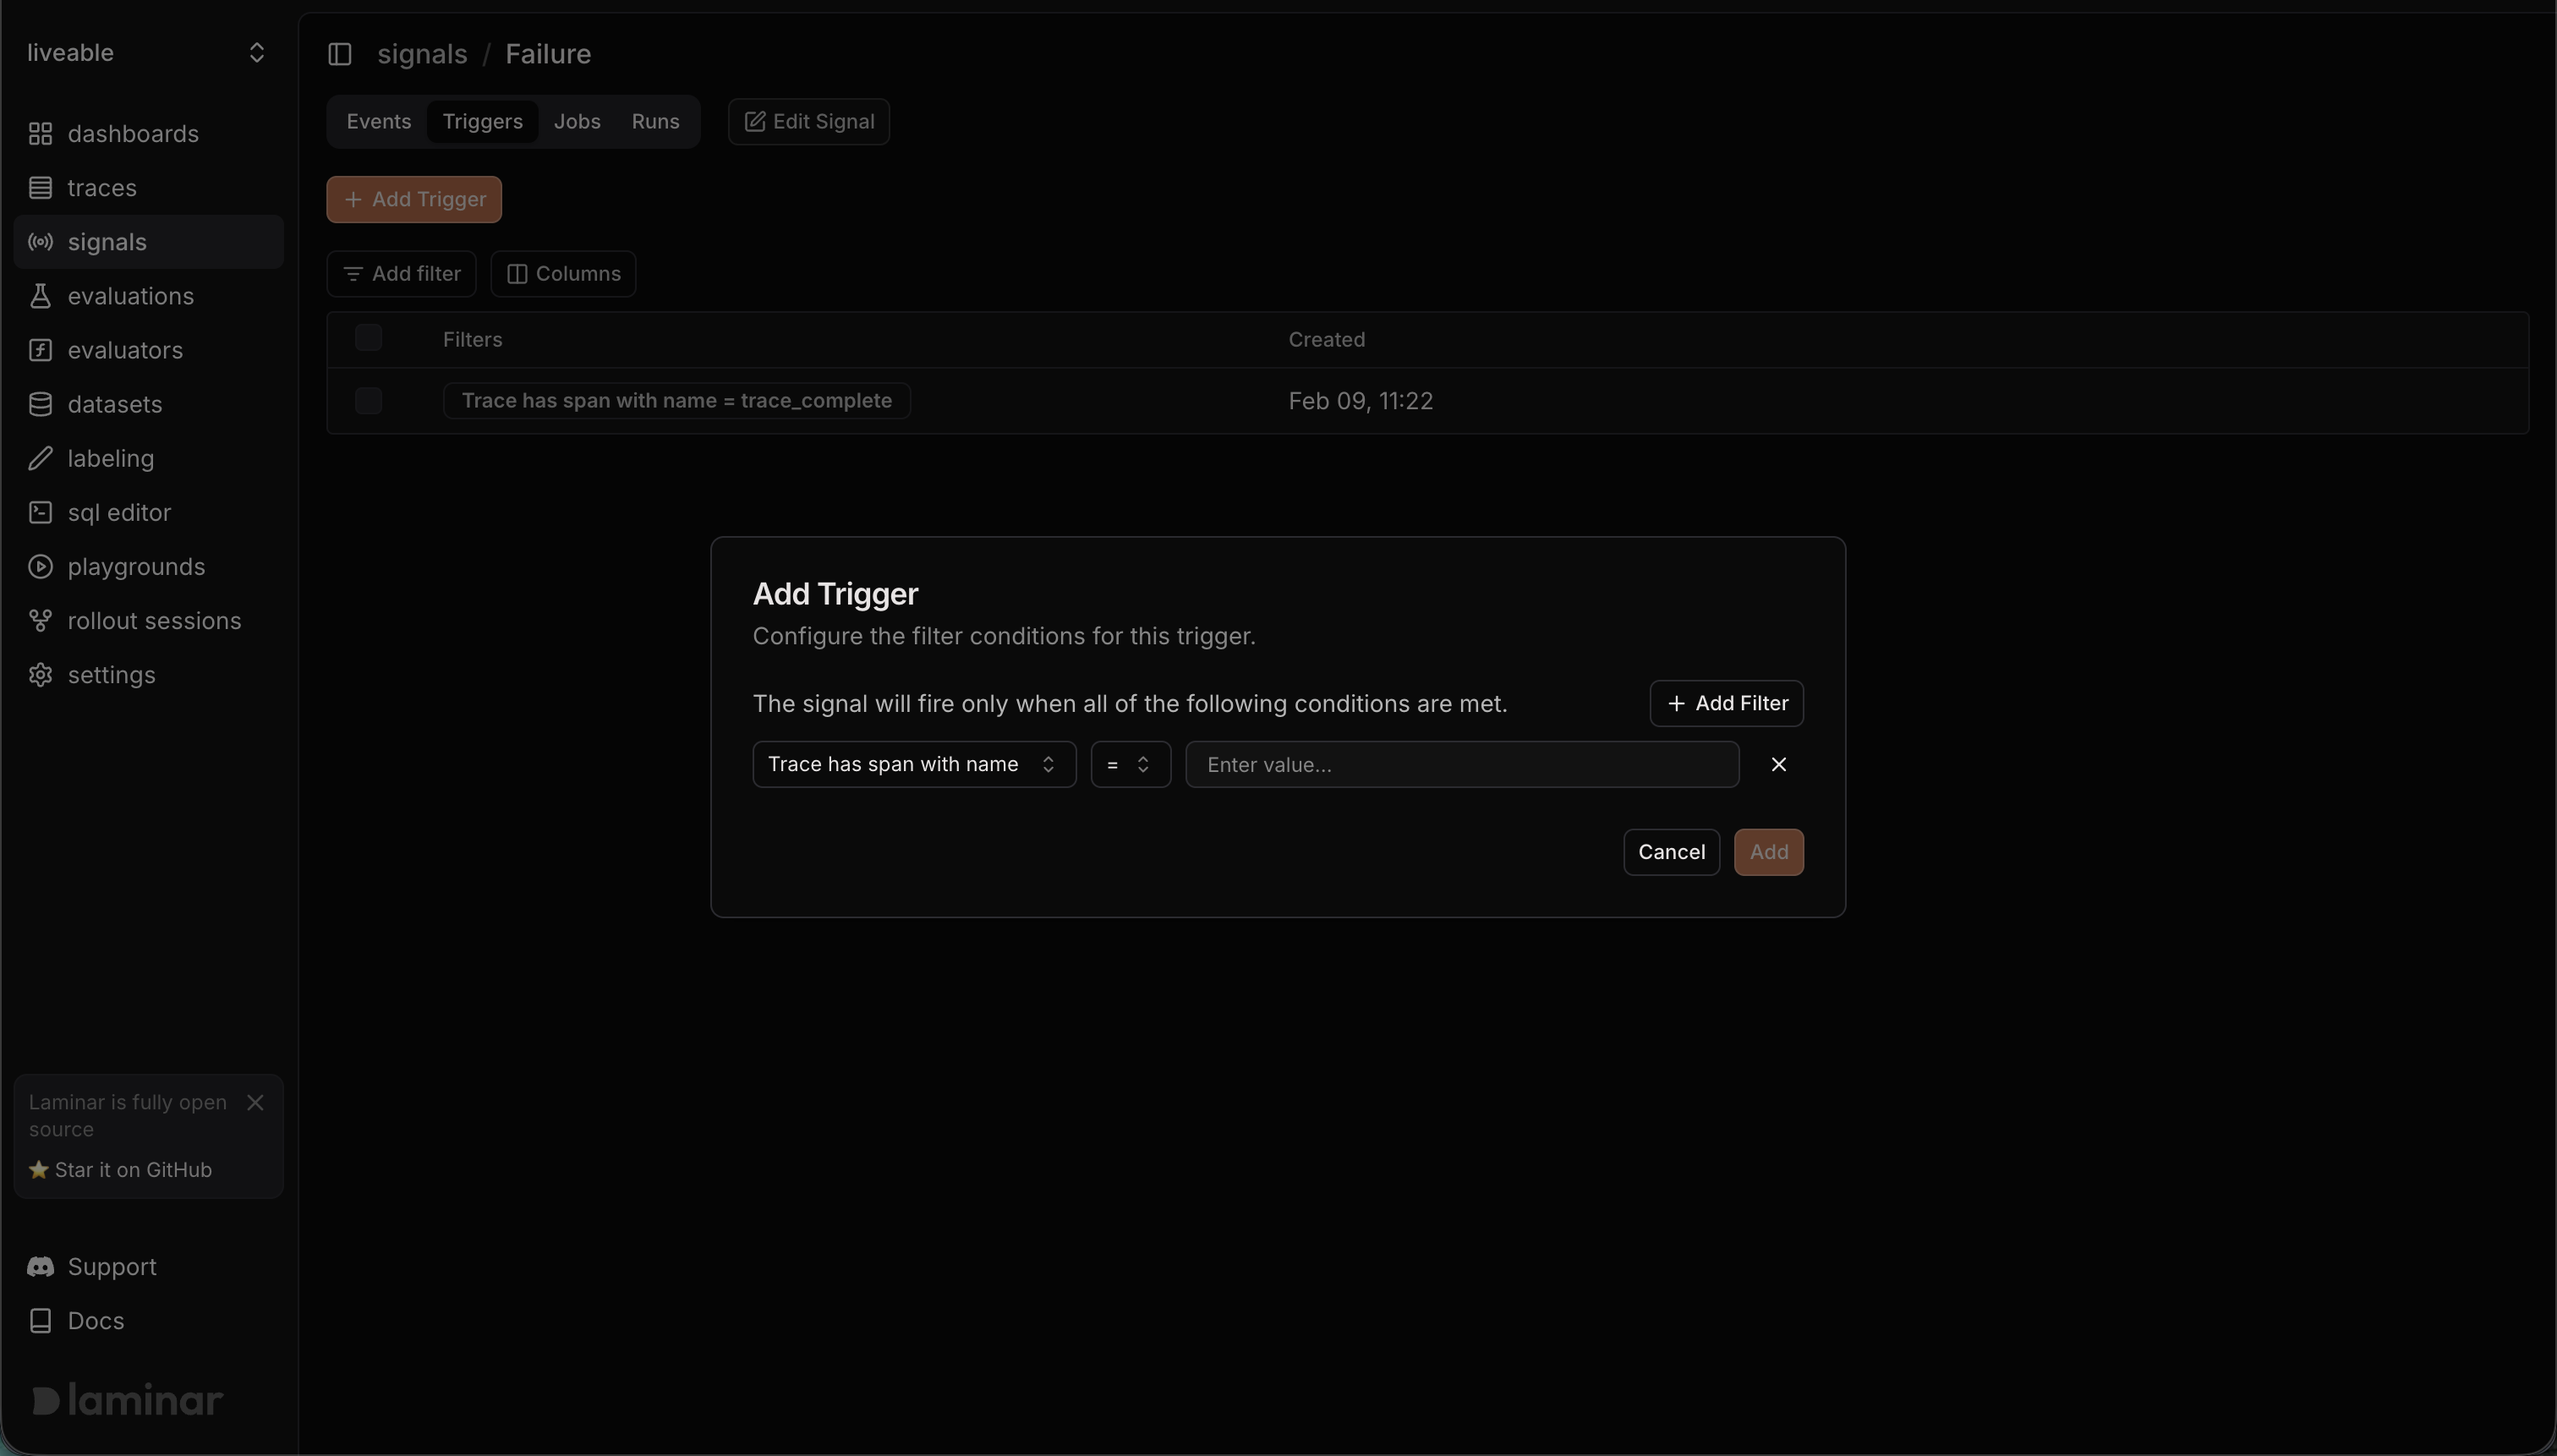
- Go to the signal’s Triggers tab and click Add Trigger.
- Add one or more filters (all conditions must match).
- The trigger runs on new traces that match those filters.
- Each matching trace creates a run with source “Trigger.”
- Signal events appear in the Events tab when identified.
Viewing signal events
In the Laminar dashboard: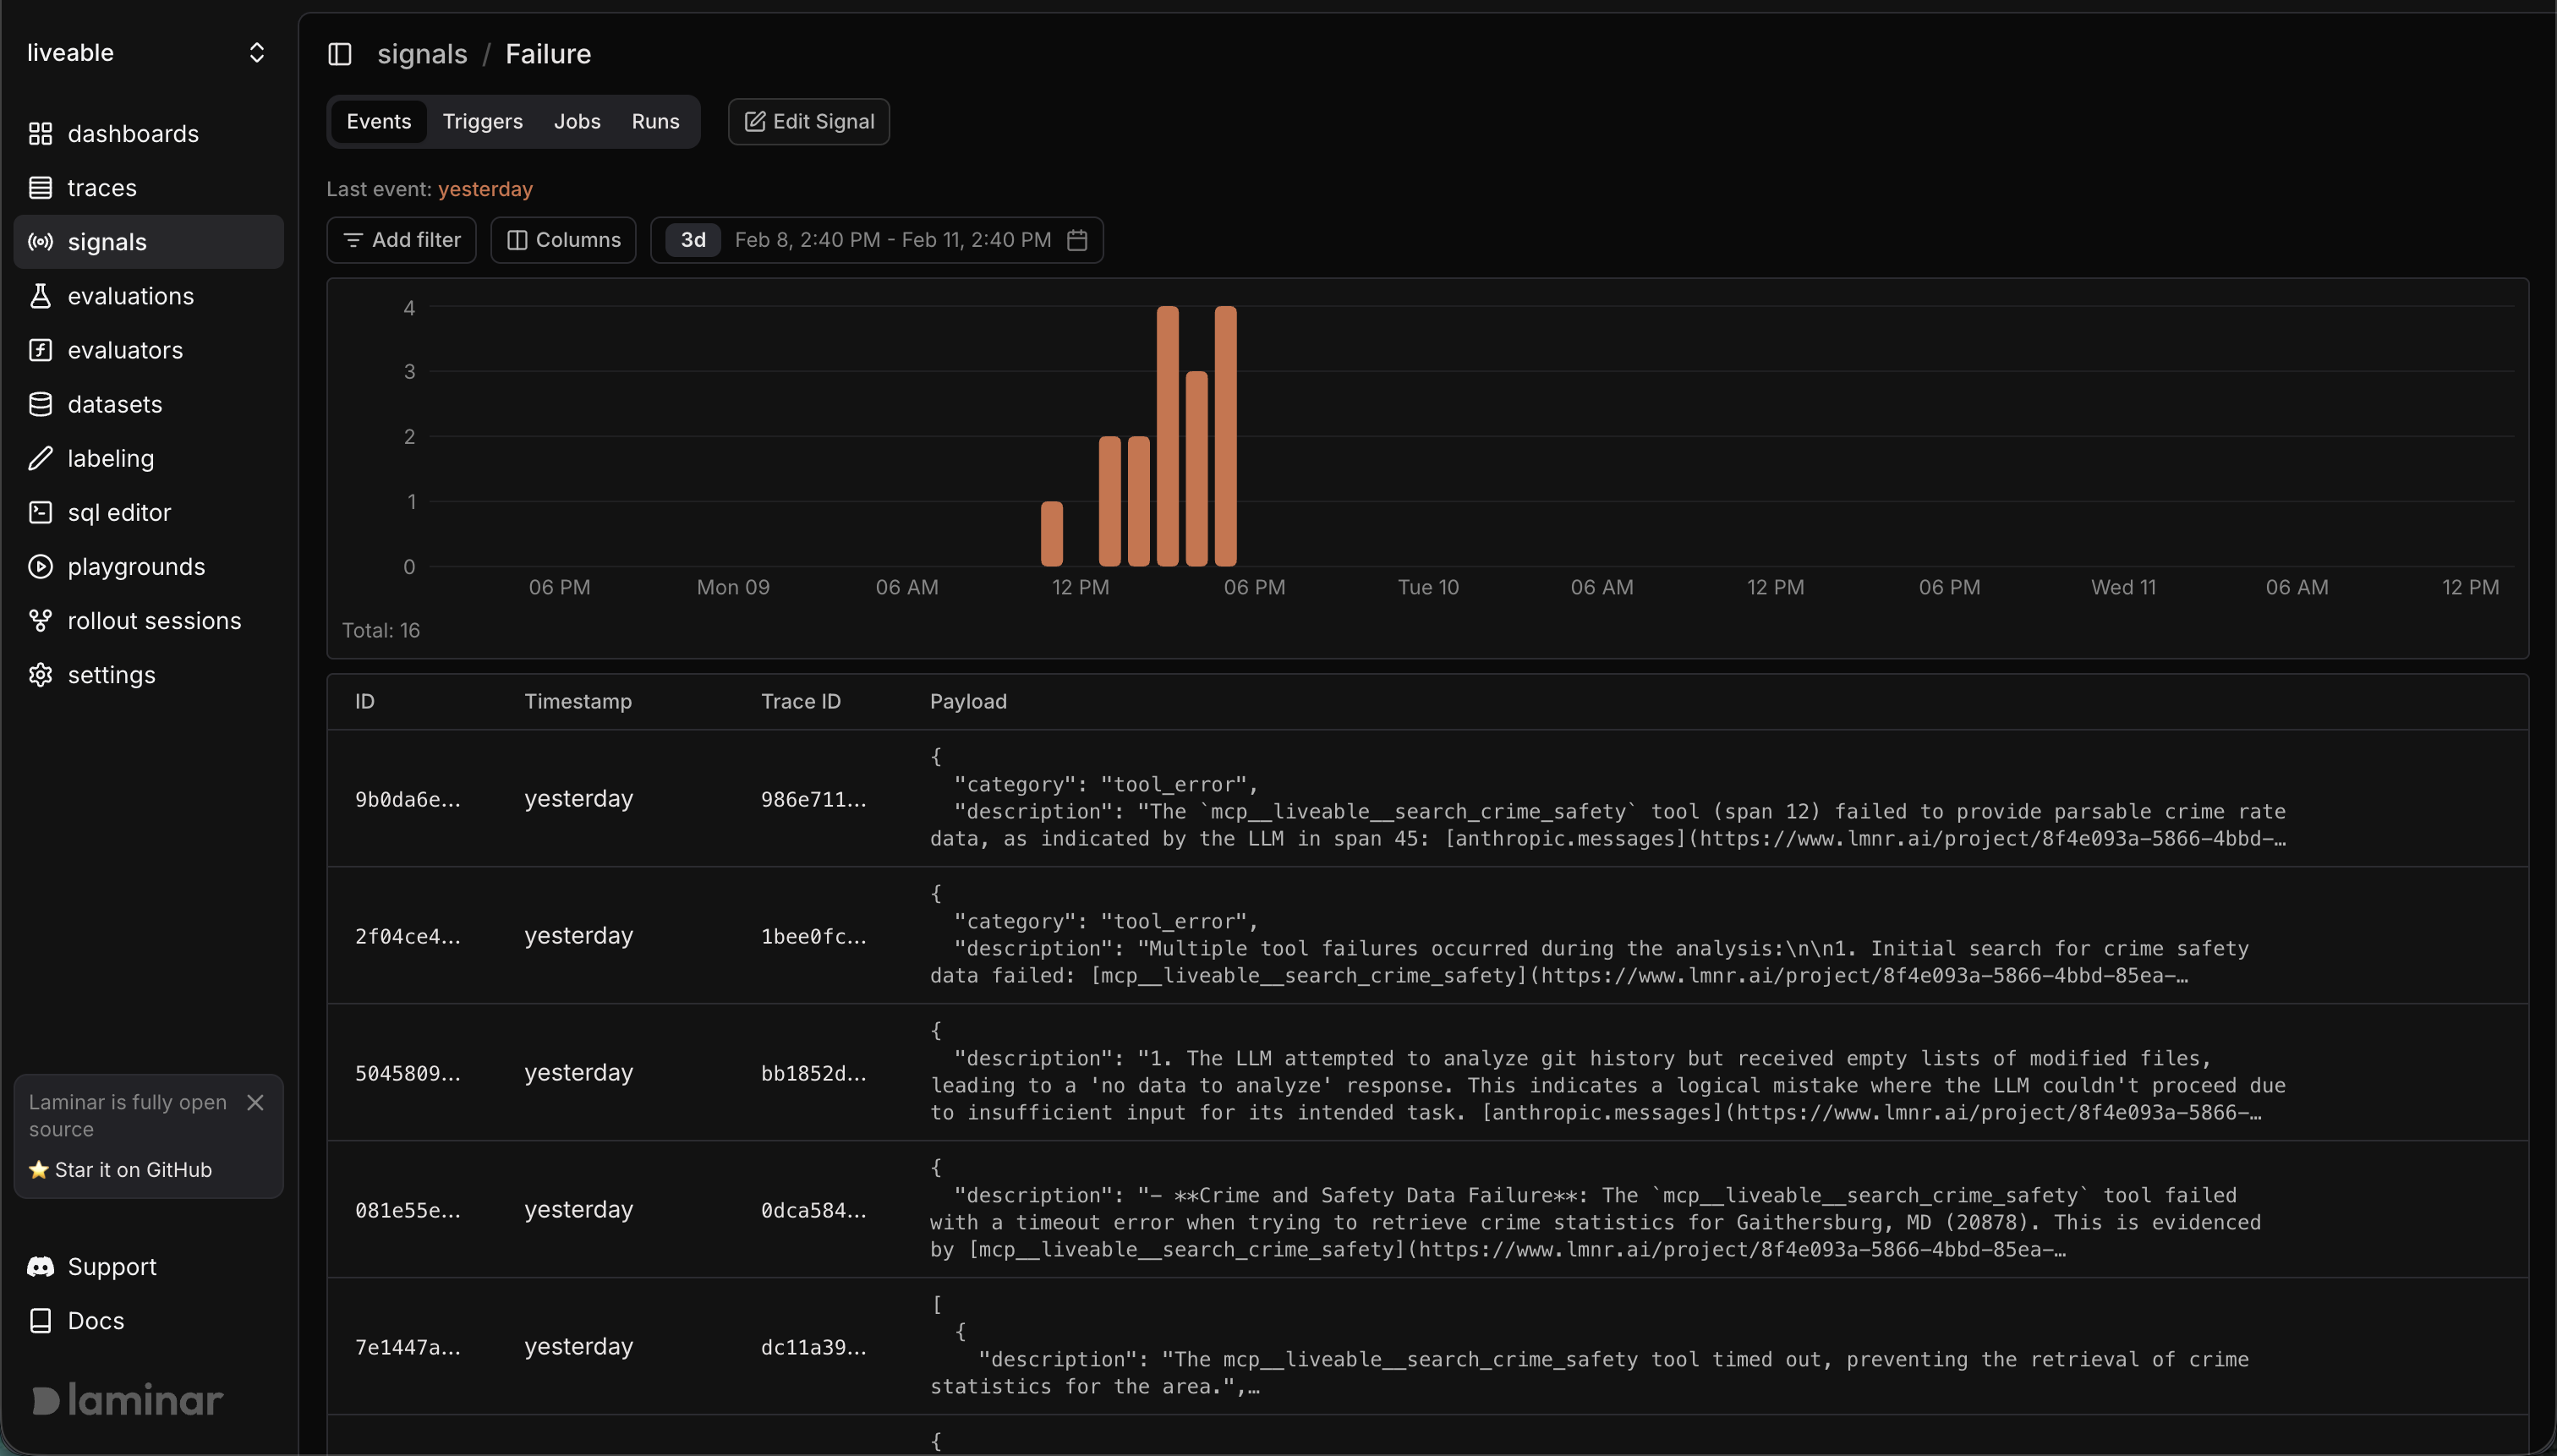
- Go to Signals and open your signal.
- Use Events to see the raw event stream and jump to traces.
- (Optional) Query signal events in the SQL Editor using the
signal_eventstable (examples below).
Querying signal_events in SQL
The signal_events table stores each event’s payload as a JSON string. The Signals UI payload filter uses a
key=value match by applying simpleJSONExtractString / simpleJSONExtractRaw to payload, so you can
mirror that behavior in SQL.
Quick payload filters (UI-equivalent)
JSONExtractFloat for numeric comparisons
JSONExtract for typed or nested fields
Clustering signal events (optional)
Laminar can cluster signal events by sending each event’s short summary to a clustering service, grouping similar events together so you can spot recurring patterns quickly. Clustering runs automatically after events are created if the clustering service is enabled in your deployment. If you’re self-hosting, make sureCLUSTERING_SERVICE_URL and CLUSTERING_SERVICE_SECRET_KEY are set to enable clustering.