Semantic Events
Semantic events is a way to track something or extract structured data that can’t be explicitly logged but can be inferred from trace data. You define a prompt that describes what to look for (for example, “Agent completes checkout process”), and our analysis LLM will produce a typed event with the fields you specify using the entire trace data as context.When to Use Semantic Events
- Business outcomes — You can describe criteria for a successful agent outcome, for example “User responded with ‘Thank you’”.
- Locagical errors — Describe a case when agent fails to complete a task, for example “Agent fails to complete checkout process”.
- Behavioral patterns — For example, you can categorize user requests to an agent by specifiying “request category” in the structured output schema.
Creating a semantic event (UI)
To define a new semantic event from trace data: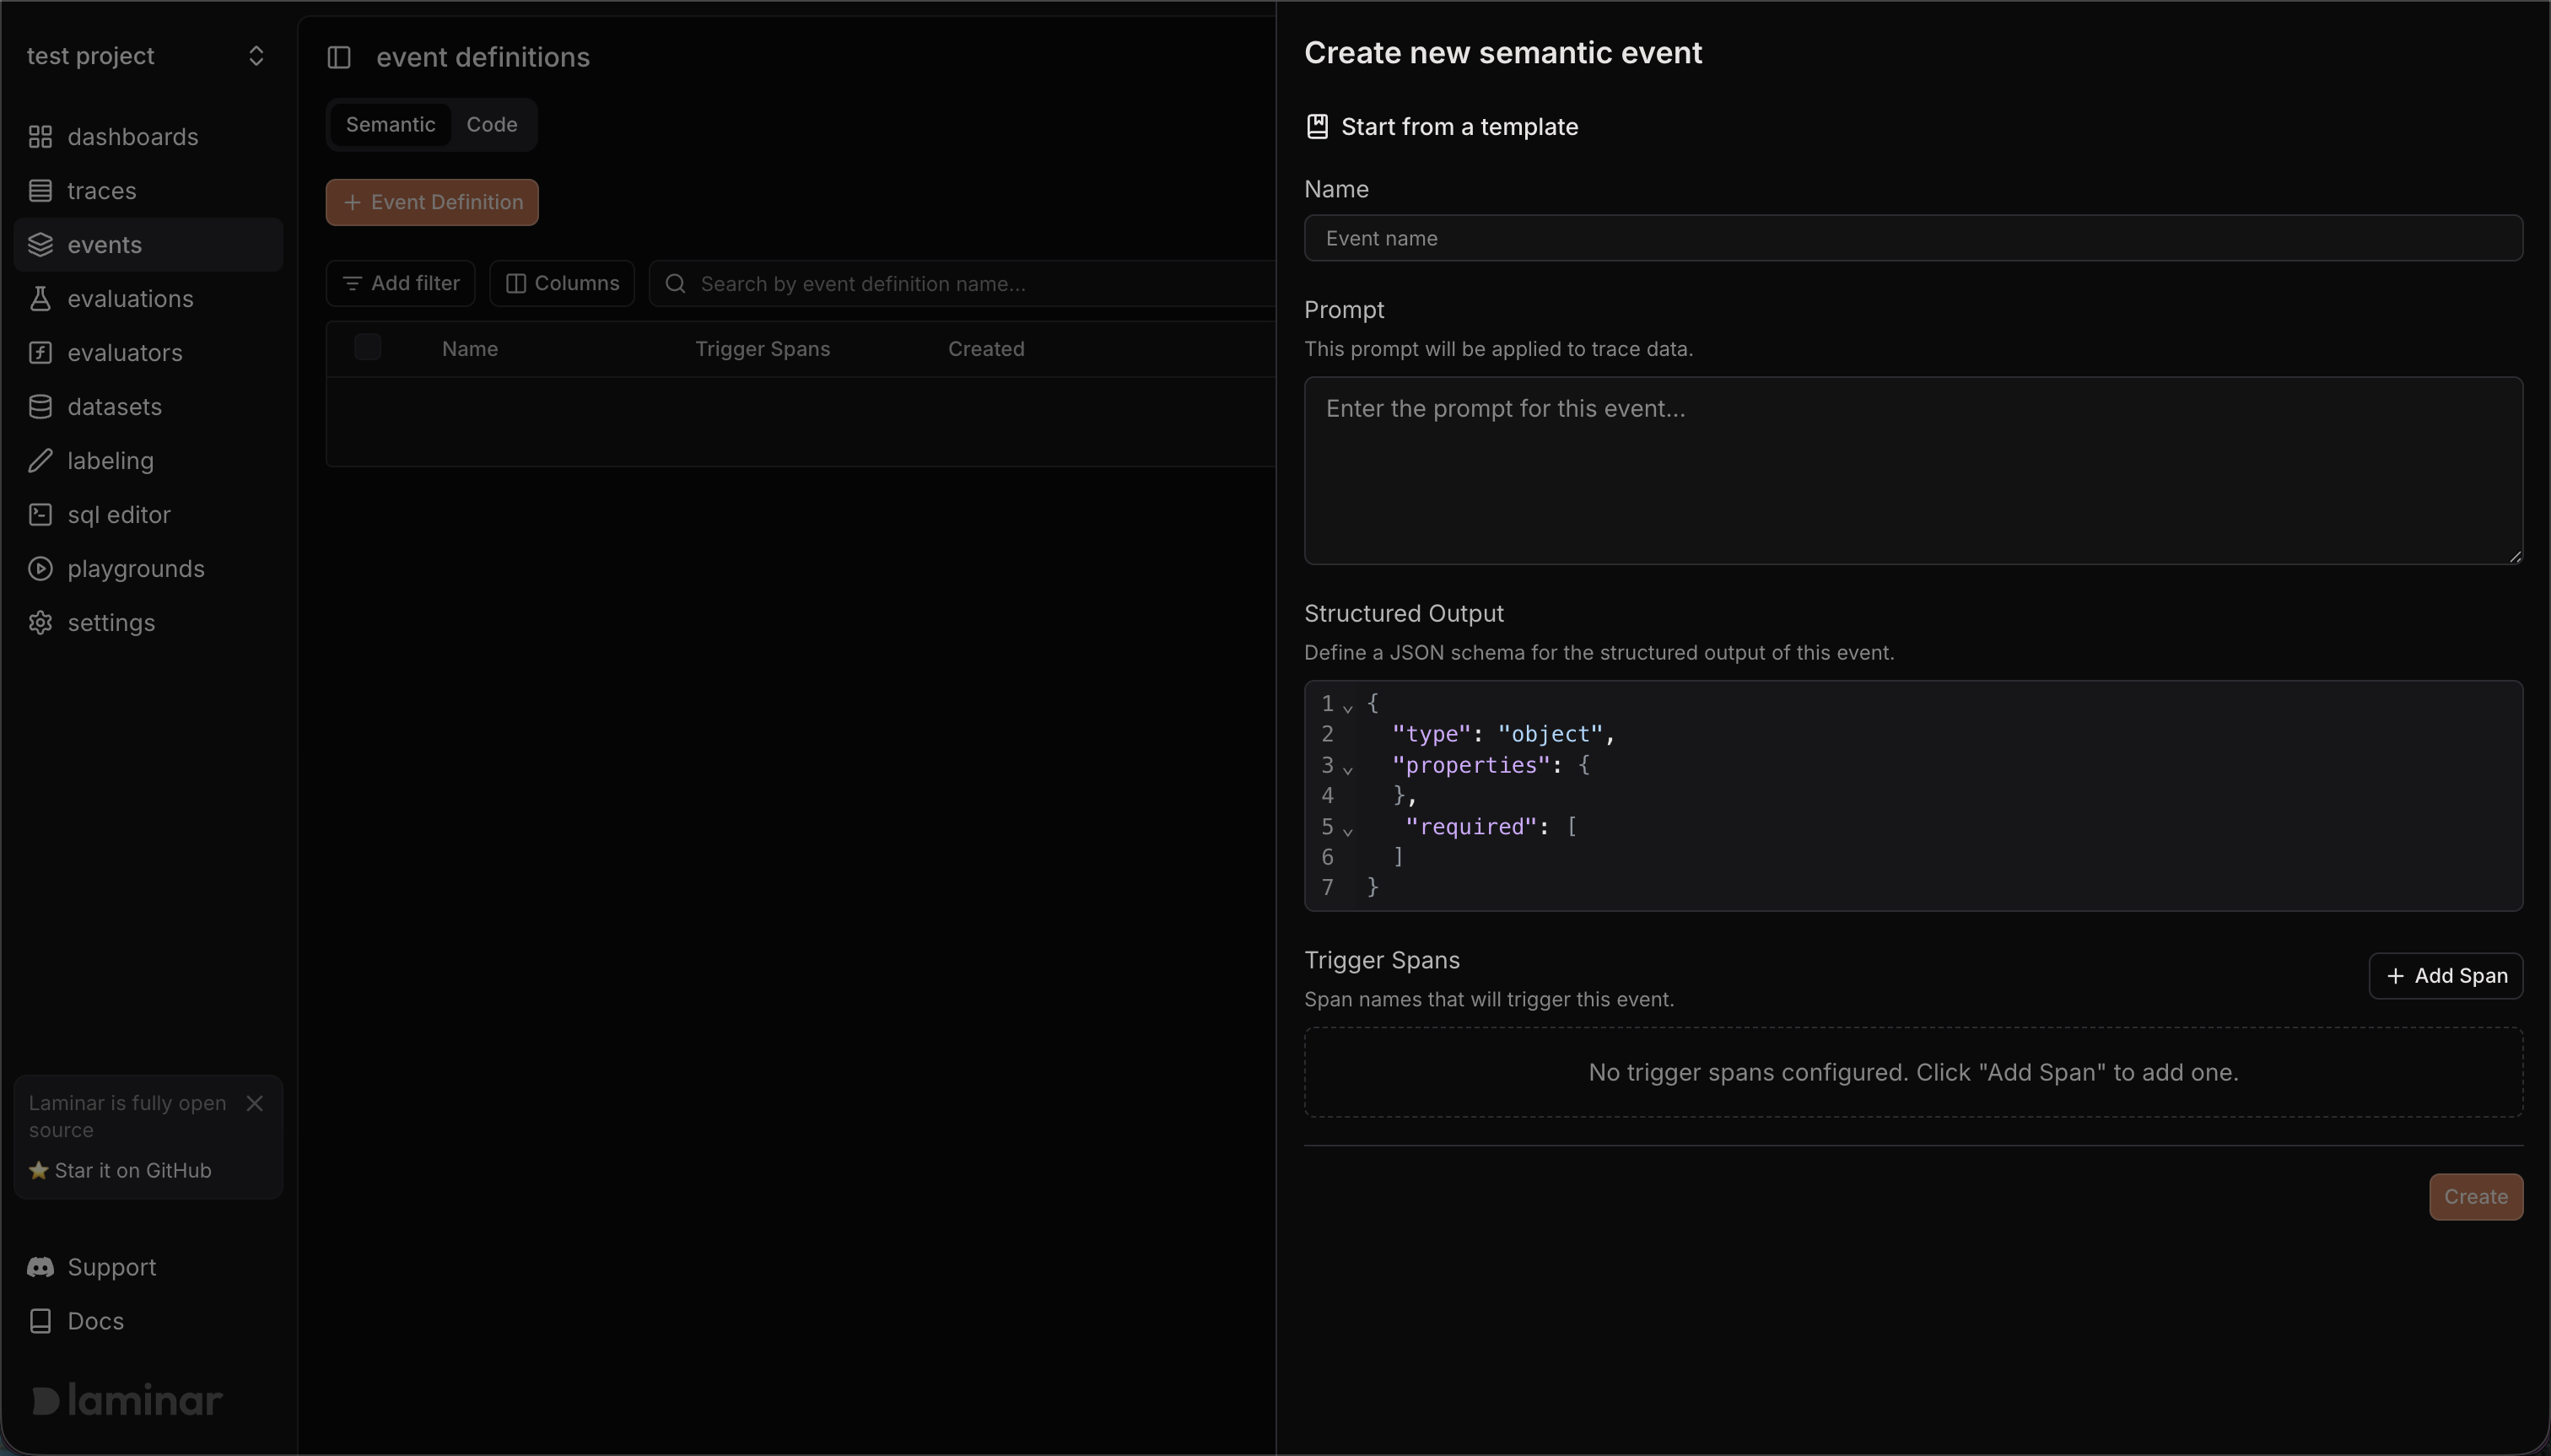
Creating a new semantic event in the Laminar UI
- Open Events → Event definitions.
- Select the Semantic tab and click + Event Definition.
- In the “Create new semantic event” panel:
- (Optional) Start from a template to prefill the prompt, schema, and trigger spans.
- Name: choose a stable event name (for example,
checkout.completedornavigation.failed). - Prompt: describe what the event should detect/extract from the trace/span data.
- Structured Output: define a JSON schema for the event payload (keep it small and stable).
- Trigger Spans: click Add Span and enter the span name(s) that should trigger this event. When Laminar recieves this span, we will initiate trace analysis and extract the event. Pick spans that is finished when the trace has enough context to infer the event, for example a span that is created when agent is done with the task.
- Click Create.
Viewing Semantic Events
In the Laminar dashboard:- Go to Events to see the raw event stream
- Filter by event type, time range, or custom attributes
- Click any event to see the trace it was extracted from
- Export events to a dataset for evaluation