@observe decorator (Python) or observe() wrapper (TypeScript) is the simplest way to trace a function. It automatically:
- Creates a span when the function is called
- Names the span after the function (or a custom name you provide)
- Captures input arguments and return values
- Ends the span when the function returns
- Records exceptions if the function throws
When to Use Observe
Use@observe / observe() when you:
- Want to trace a function call
- Want automatic input/output capture
- Want a stable span name based on the function (or an explicit name)
- Want a parent span that groups downstream work (LLM calls, tool calls, DB calls)
Nesting Behavior
Observed functions automatically nest. If function A calls function B, and both are observed, B’s span becomes a child of A’s span. This happens through context propagation—Laminar tracks the “current” span and parents new spans to it. You can also create additional spans inside an observed function. Those spans become children of the observed function’s span.
Example
Wrap a function you own so it shows up as a parent operation with downstream spans (LLM calls, tools, etc.) nested inside it.- TypeScript
- Python
observe(options, fn, ...args)In the Laminar UI
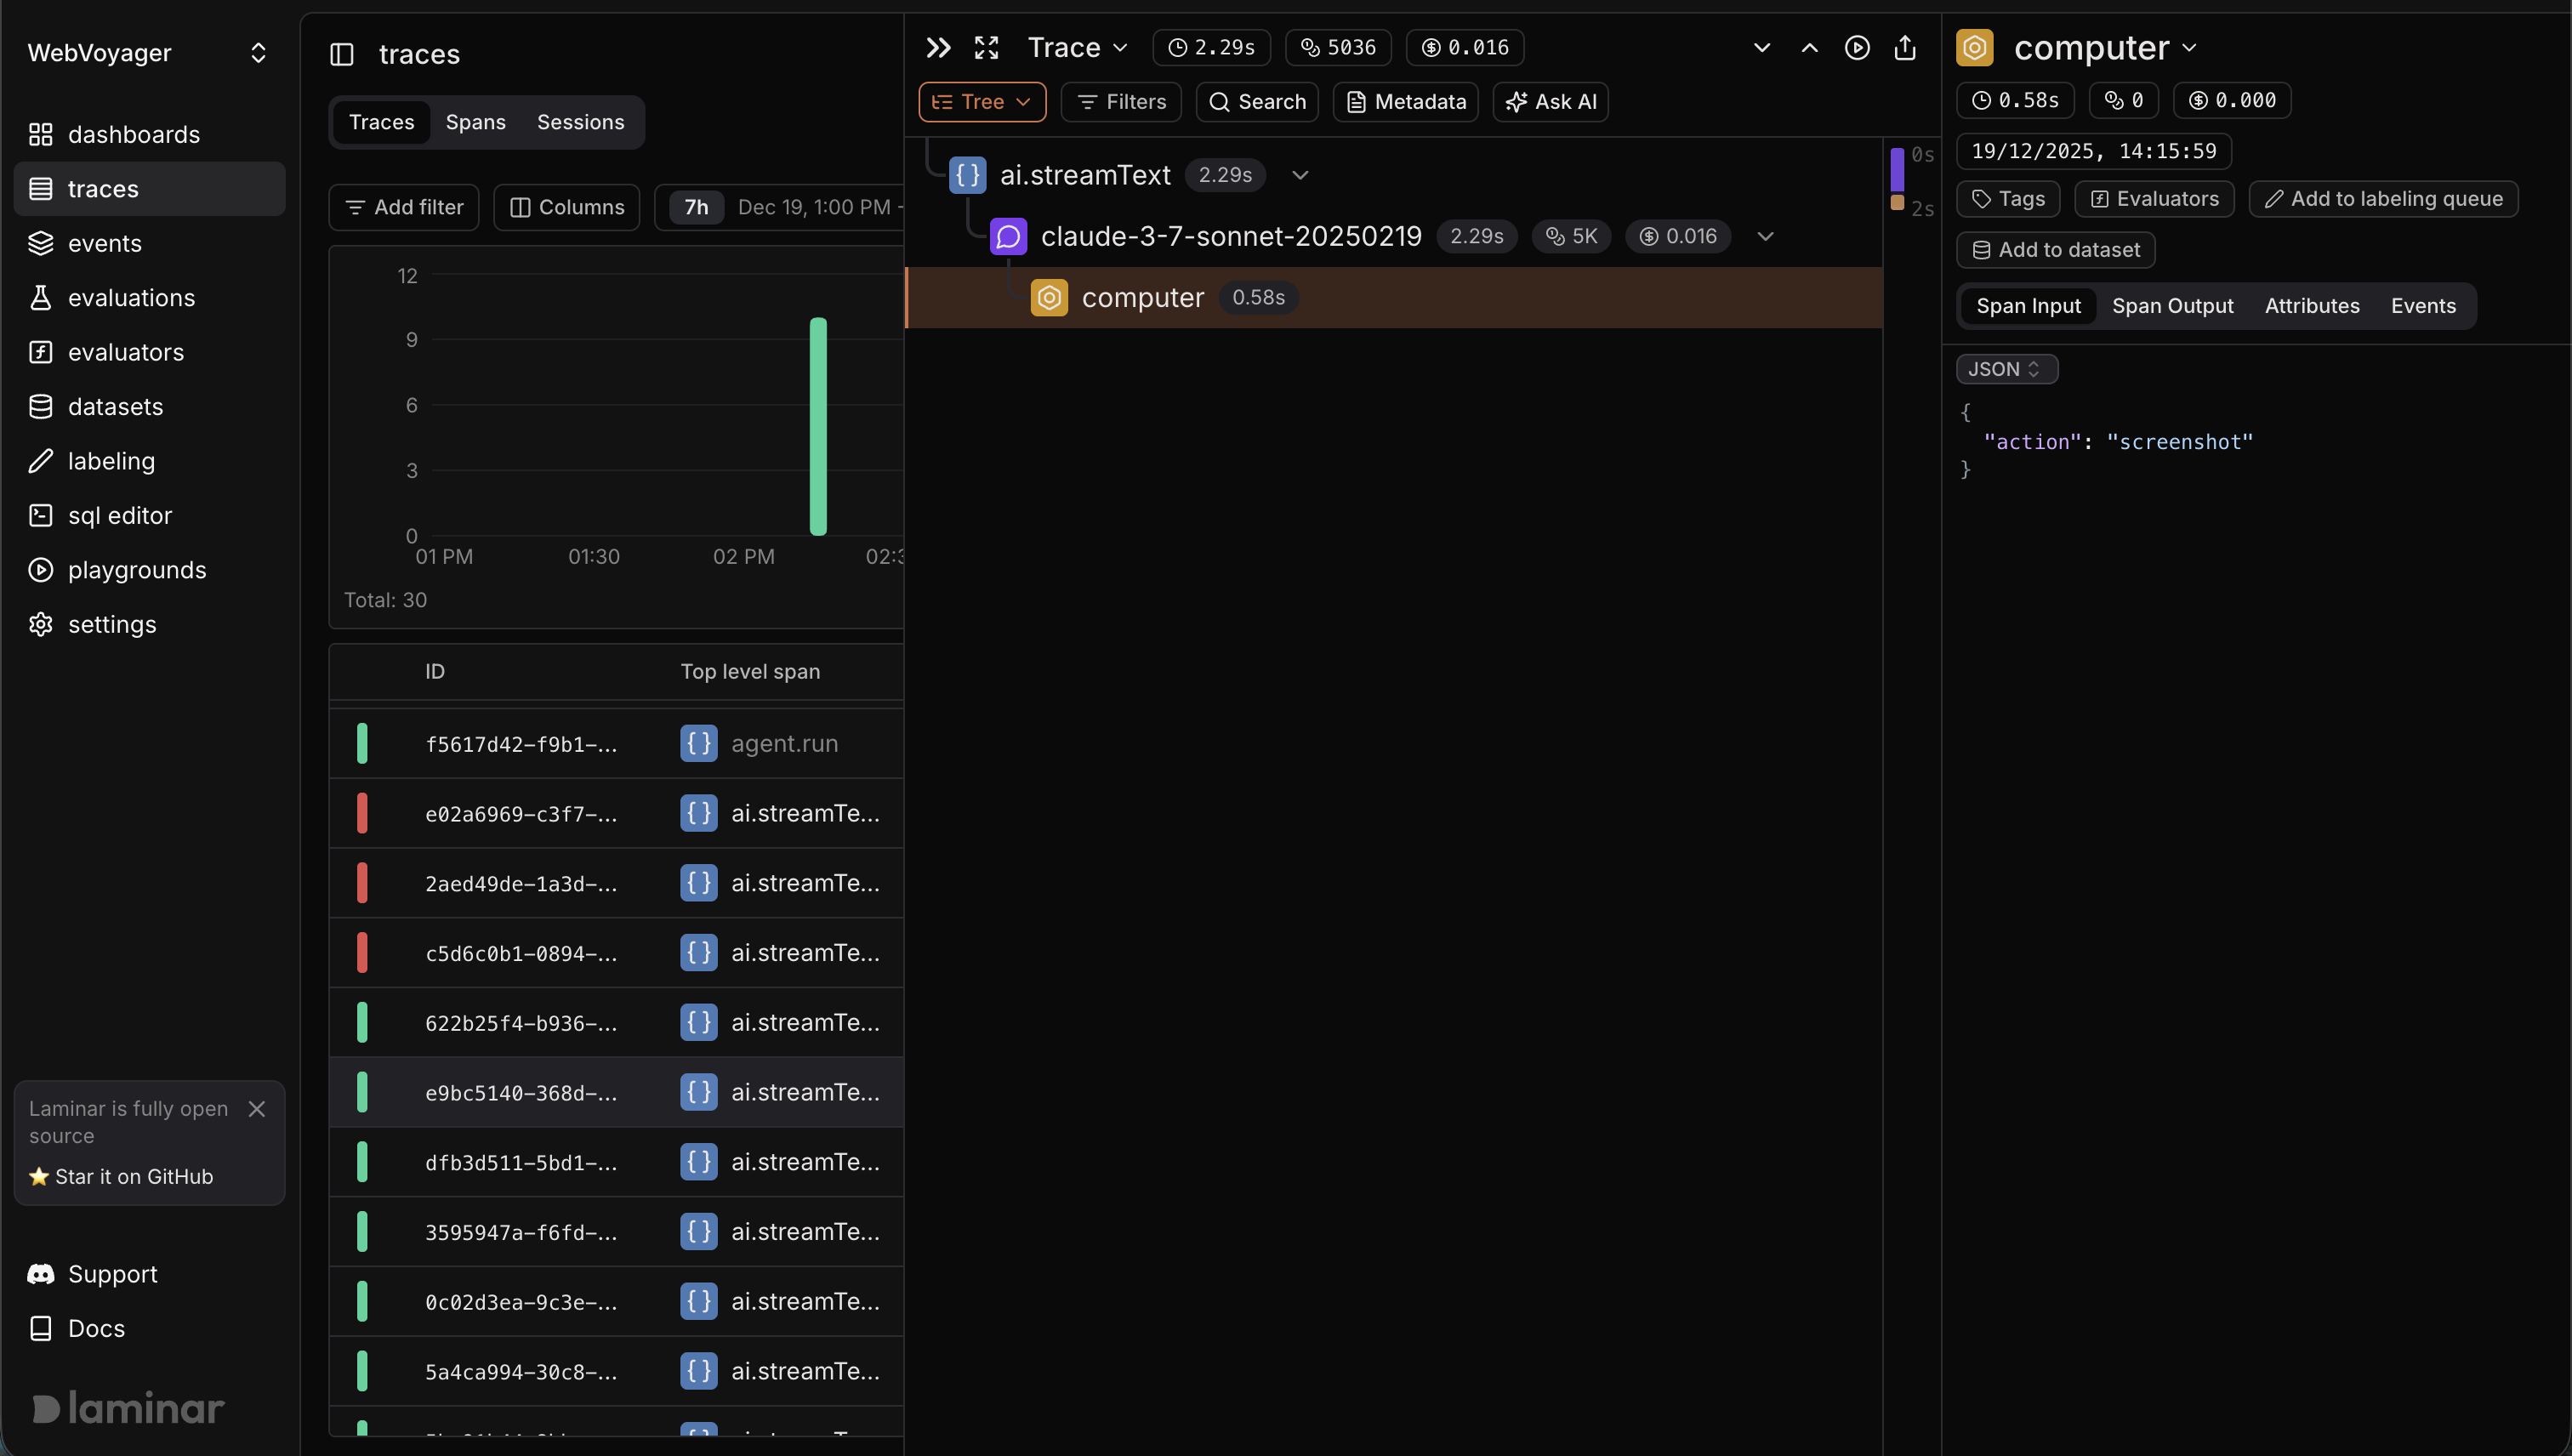
- The observed function appears as a span (often the root span for the trace).
- Auto-instrumented work inside it (LLM calls, vector DB calls, etc.) appears as child spans.
- Function arguments are recorded as span input and the return value as span output (unless you disable or override recording).
